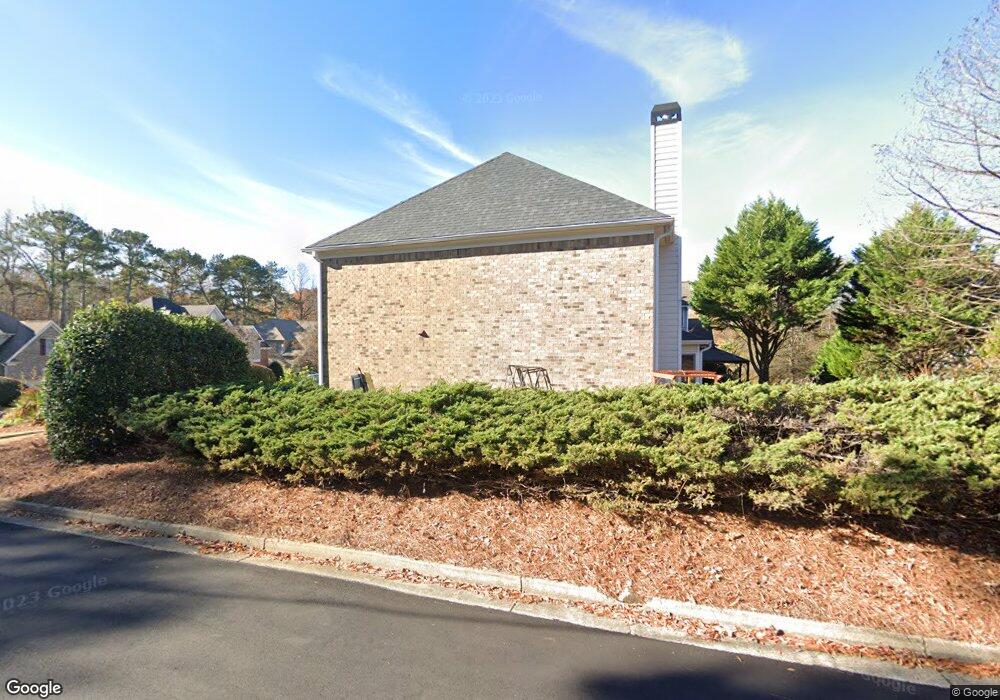
5040 Thornbury Way Alpharetta, GA 30005
Estimated Value: $707,000 - $929,000
4
Beds
4
Baths
3,227
Sq Ft
$254/Sq Ft
Est. Value
About This Home
This home is located at 5040 Thornbury Way, Alpharetta, GA 30005 and is currently estimated at $818,925, approximately $253 per square foot. 5040 Thornbury Way is a home located in Fulton County with nearby schools including Lake Windward Elementary School, Webb Bridge Middle School, and Alpharetta High School.
Ownership History
Date
Name
Owned For
Owner Type
Purchase Details
Closed on
Nov 29, 2004
Sold by
Supehia Sanjay K
Bought by
Supehia Sanjay K and Supehia Indira
Current Estimated Value
Home Financials for this Owner
Home Financials are based on the most recent Mortgage that was taken out on this home.
Original Mortgage
$271,956
Outstanding Balance
$126,125
Interest Rate
4.63%
Mortgage Type
New Conventional
Estimated Equity
$692,800
Create a Home Valuation Report for This Property
The Home Valuation Report is an in-depth analysis detailing your home's value as well as a comparison with similar homes in the area
Home Values in the Area
Average Home Value in this Area
Purchase History
| Date | Buyer | Sale Price | Title Company |
|---|---|---|---|
| Supehia Sanjay K | -- | -- | |
| Supehia Sanjay K | $340,000 | -- |
Source: Public Records
Mortgage History
| Date | Status | Borrower | Loan Amount |
|---|---|---|---|
| Open | Supehia Sanjay K | $271,956 | |
| Closed | Supehia Sanjay K | $50,992 |
Source: Public Records
Tax History Compared to Growth
Tax History
| Year | Tax Paid | Tax Assessment Tax Assessment Total Assessment is a certain percentage of the fair market value that is determined by local assessors to be the total taxable value of land and additions on the property. | Land | Improvement |
|---|---|---|---|---|
| 2025 | $782 | $326,000 | $78,400 | $247,600 |
| 2023 | $5,942 | $210,520 | $48,880 | $161,640 |
| 2022 | $4,211 | $210,520 | $48,880 | $161,640 |
| 2021 | $4,469 | $164,640 | $37,000 | $127,640 |
| 2020 | $4,647 | $176,280 | $47,240 | $129,040 |
| 2019 | $654 | $173,160 | $46,400 | $126,760 |
| 2018 | $4,431 | $169,080 | $45,320 | $123,760 |
| 2017 | $3,635 | $136,520 | $37,160 | $99,360 |
| 2016 | $3,634 | $136,520 | $37,160 | $99,360 |
| 2015 | $4,233 | $136,520 | $37,160 | $99,360 |
| 2014 | $3,794 | $136,520 | $37,160 | $99,360 |
Source: Public Records
Map
Nearby Homes
- 2800 Lakewind Ct
- 5200 Cresslyn Ridge
- 1895 Oak Tree Hollow
- 680 Kimball Parc Way
- 690 Kimball Parc Way
- 485 Portrait Cir
- 11619 Davenport Ln
- 4905 Weathervane Dr
- 1075 Carnoustie Ln
- 1620 Silverleaf Way
- 1140 Park Glenn Dr
- 520 Flying Scot Way
- 11835 Leeward Walk Cir
- 440 Newport Heights
- 4440 Webb Bridge Rd
- 5160 Abbotts Bridge Rd
- 2250 Blackheath Trace
- 5325 Hillgate Crossing
- 5030 Thornbury Way
- 5020 Thornbury Way
- 255 Foxthorne Way Unit 53
- 255 Foxthorne Way
- 245 Foxthorne Way
- 245 Foxthorne Way Unit 245
- 11929 Thornbury View Unit 2
- 5010 Thornbury Way
- 5085 Thornbury Way
- 11895 Fox Rd
- 235 Foxthorne Way
- 0 Thornbury View Unit 3256803
- 0 Thornbury View Unit 8994617
- 0 Thornbury View Unit 8387442
- 0 Thornbury View
- 260 Foxthorne Way
- 11933 Thornbury View
- 5065 Thornbury Way
- 5000 Thornbury Way
- 225 Foxthorne Way