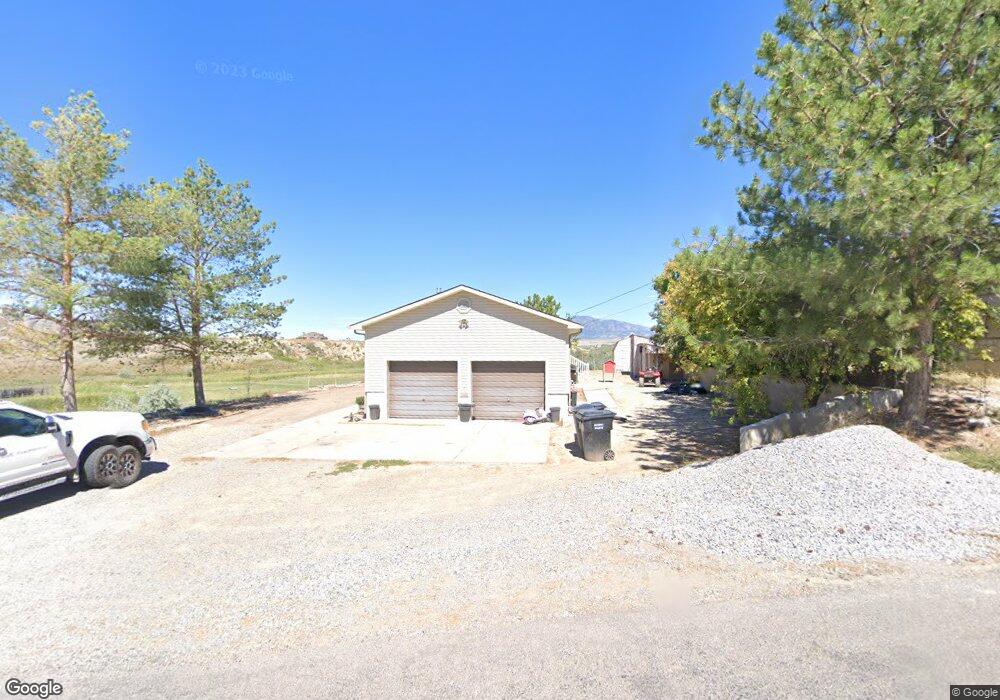
5040 W 14400 N Garland, UT 84312
Estimated Value: $384,295 - $523,000
--
Bed
--
Bath
1,244
Sq Ft
$353/Sq Ft
Est. Value
About This Home
This home is located at 5040 W 14400 N, Garland, UT 84312 and is currently estimated at $439,074, approximately $352 per square foot. 5040 W 14400 N is a home located in Box Elder County with nearby schools including Fielding School, Bear River Middle School, and Alice C. Harris Intermediate School.
Ownership History
Date
Name
Owned For
Owner Type
Purchase Details
Closed on
Dec 8, 2021
Sold by
Stokes Sean R
Bought by
Stokes Sean R and Stokes Erin
Current Estimated Value
Home Financials for this Owner
Home Financials are based on the most recent Mortgage that was taken out on this home.
Original Mortgage
$440,100
Outstanding Balance
$404,939
Interest Rate
3.14%
Mortgage Type
New Conventional
Estimated Equity
$34,135
Purchase Details
Closed on
Mar 18, 2020
Sold by
Stokes Sean R
Bought by
Stokes Sean and Stokes Erin
Home Financials for this Owner
Home Financials are based on the most recent Mortgage that was taken out on this home.
Original Mortgage
$321,530
Interest Rate
3.4%
Mortgage Type
FHA
Purchase Details
Closed on
Aug 3, 2018
Sold by
Davis Gary L and Davis Janet B
Bought by
Stokes Sean R
Home Financials for this Owner
Home Financials are based on the most recent Mortgage that was taken out on this home.
Original Mortgage
$165,938
Interest Rate
5.5%
Mortgage Type
FHA
Create a Home Valuation Report for This Property
The Home Valuation Report is an in-depth analysis detailing your home's value as well as a comparison with similar homes in the area
Home Values in the Area
Average Home Value in this Area
Purchase History
| Date | Buyer | Sale Price | Title Company |
|---|---|---|---|
| Stokes Sean R | -- | Us Title Insurance Agency | |
| Stokes Sean R | -- | Us Title Insurance Agency | |
| Stokes Sean | -- | Northern Title Company | |
| Stokes Sean R | -- | Us Title Insurance Agency |
Source: Public Records
Mortgage History
| Date | Status | Borrower | Loan Amount |
|---|---|---|---|
| Open | Stokes Sean R | $440,100 | |
| Closed | Stokes Sean | $321,530 | |
| Closed | Stokes Sean R | $165,938 |
Source: Public Records
Tax History Compared to Growth
Tax History
| Year | Tax Paid | Tax Assessment Tax Assessment Total Assessment is a certain percentage of the fair market value that is determined by local assessors to be the total taxable value of land and additions on the property. | Land | Improvement |
|---|---|---|---|---|
| 2025 | $1,856 | $357,490 | $128,000 | $229,490 |
| 2024 | $1,625 | $355,320 | $128,000 | $227,320 |
| 2023 | $1,660 | $367,732 | $127,200 | $240,532 |
| 2022 | $1,496 | $172,499 | $24,640 | $147,859 |
| 2021 | $1,251 | $138,213 | $27,000 | $111,213 |
| 2020 | $761 | $138,213 | $27,000 | $111,213 |
| 2019 | $687 | $4,000 | $2,000 | $2,000 |
| 2018 | $662 | $60,074 | $15,750 | $44,324 |
| 2017 | $687 | $107,589 | $15,750 | $80,589 |
| 2016 | $657 | $57,963 | $15,750 | $42,213 |
| 2015 | $599 | $54,126 | $14,100 | $40,026 |
| 2014 | $599 | $52,220 | $14,100 | $38,120 |
| 2013 | -- | $48,754 | $12,100 | $36,654 |
Source: Public Records
Map
Nearby Homes
- 14296 N 5350 W
- 4770 W 13600 N
- 14360 N 6000 W
- 14376 N 6000 W
- 15270 N 5475 W
- 15125 N 4400 W
- 14345 N 6000 W
- 13200 N 6000 W
- 16449 N 6000 W
- 627 N Main St
- 15920 N 4000 W Unit 14
- 3536 W 14100 N
- 112 S Main St
- 16115 N 6000 W
- Berrington Plan at Lookout Mountain
- Stanton Plan at Lookout Mountain
- Cambria Plan at Lookout Mountain
- Brantwood Plan at Lookout Mountain
- Hallwood Plan at Lookout Mountain
- Vanbrough Plan at Lookout Mountain
- 5040 W 14400 N
- 4720 W 14400 N
- 4945 W 14400 N
- 4870 W 14400 N
- 4600 W 14400 N
- 5935 W 14400 N Unit 1
- 5035 W 14400 N
- 5020 W 14400 N
- 5010 W 14400 N
- 4990 W 14400 N
- 5070 W 14400 N
- 4970 W 14400 N
- 4975 W 14400 N
- 4965 W 14400 N
- 4950 W 14400 N
- 4930 W 14400 N
- 4925 W 14400 N
- 4910 W 14400 N
- 5271 W 14400 N
- 4881 W 14400 N