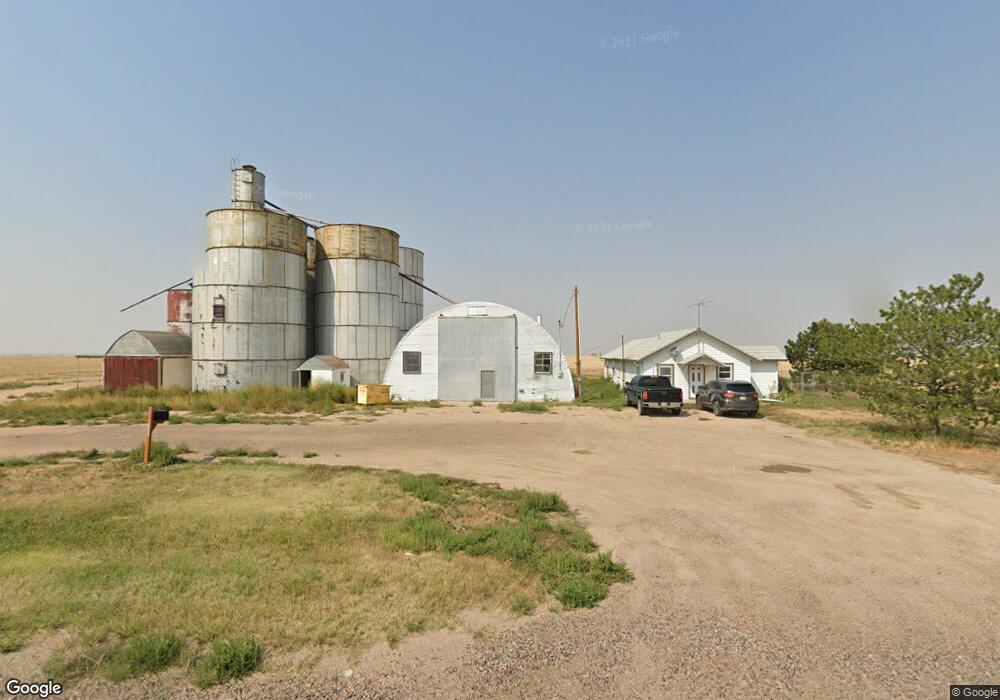
50415 E 88th Ave Bennett, CO 80102
Estimated Value: $722,000 - $797,000
4
Beds
3
Baths
2,185
Sq Ft
$346/Sq Ft
Est. Value
About This Home
This home is located at 50415 E 88th Ave, Bennett, CO 80102 and is currently estimated at $756,015, approximately $346 per square foot. 50415 E 88th Ave is a home located in Adams County with nearby schools including Bennett Elementary School, Bennett Middle School, and Bennett High School.
Ownership History
Date
Name
Owned For
Owner Type
Purchase Details
Closed on
Jun 29, 2010
Sold by
Fannie Mae
Bought by
Kosik Steven J
Current Estimated Value
Home Financials for this Owner
Home Financials are based on the most recent Mortgage that was taken out on this home.
Original Mortgage
$100,000
Outstanding Balance
$65,579
Interest Rate
4.77%
Mortgage Type
New Conventional
Estimated Equity
$690,436
Purchase Details
Closed on
Apr 15, 2010
Sold by
Nelson Steven W and Nelson Ruth J
Bought by
Federal National Mortgage Association
Purchase Details
Closed on
May 1, 2000
Sold by
Nelson Steven W and Nelson Ruth J
Bought by
Hartman Kelly L and Hartman Christine L
Create a Home Valuation Report for This Property
The Home Valuation Report is an in-depth analysis detailing your home's value as well as a comparison with similar homes in the area
Purchase History
| Date | Buyer | Sale Price | Title Company |
|---|---|---|---|
| Kosik Steven J | $259,500 | None Available | |
| Federal National Mortgage Association | -- | None Available | |
| Hartman Kelly L | -- | -- |
Source: Public Records
Mortgage History
| Date | Status | Borrower | Loan Amount |
|---|---|---|---|
| Open | Kosik Steven J | $100,000 |
Source: Public Records
Tax History
| Year | Tax Paid | Tax Assessment Tax Assessment Total Assessment is a certain percentage of the fair market value that is determined by local assessors to be the total taxable value of land and additions on the property. | Land | Improvement |
|---|---|---|---|---|
| 2025 | $2,076 | $46,120 | $11,040 | $35,080 |
| 2024 | $2,076 | $42,640 | $10,390 | $32,250 |
| 2023 | $2,542 | $40,370 | $9,000 | $31,370 |
| 2022 | $2,379 | $41,430 | $9,200 | $32,230 |
| 2021 | $2,920 | $41,430 | $9,200 | $32,230 |
| 2020 | $2,762 | $41,170 | $8,010 | $33,160 |
| 2019 | $2,861 | $41,170 | $8,010 | $33,160 |
| 2018 | $2,677 | $34,860 | $6,240 | $28,620 |
| 2017 | $2,676 | $34,860 | $6,240 | $28,620 |
| 2016 | $1,774 | $22,630 | $1,740 | $20,890 |
| 2015 | $1,757 | $22,630 | $1,740 | $20,890 |
| 2014 | $1,481 | $18,560 | $1,450 | $17,110 |
Source: Public Records
Map
Nearby Homes
- 8555 Converse Rd
- 0 Vacant Land Parcel 2 Unit REC5959024
- 47081 E 106th Ave
- 1 Lots 1-6 Vacant Land Penrith
- 1 Vacant Land Penrith
- 0 Tbd E 112th Ave Unit REC1788626
- 51315 E 56th Ave
- 50700 E 104th Ave
- 44000 E 88th Ave
- 49531 E 56th Ave
- 8475 Strasburg Rd
- 8375 Strasburg Rd
- 48155 E 56th Ave
- 8255 Strasburg Rd
- 5549 Yulle Rd
- 56520 E 74th Dr
- 56801 E 76th Ave
- 43201 E 88th Ave
- 47790 E 72nd Ave
- 6945 Strasburg Rd
Your Personal Tour Guide
Ask me questions while you tour the home.