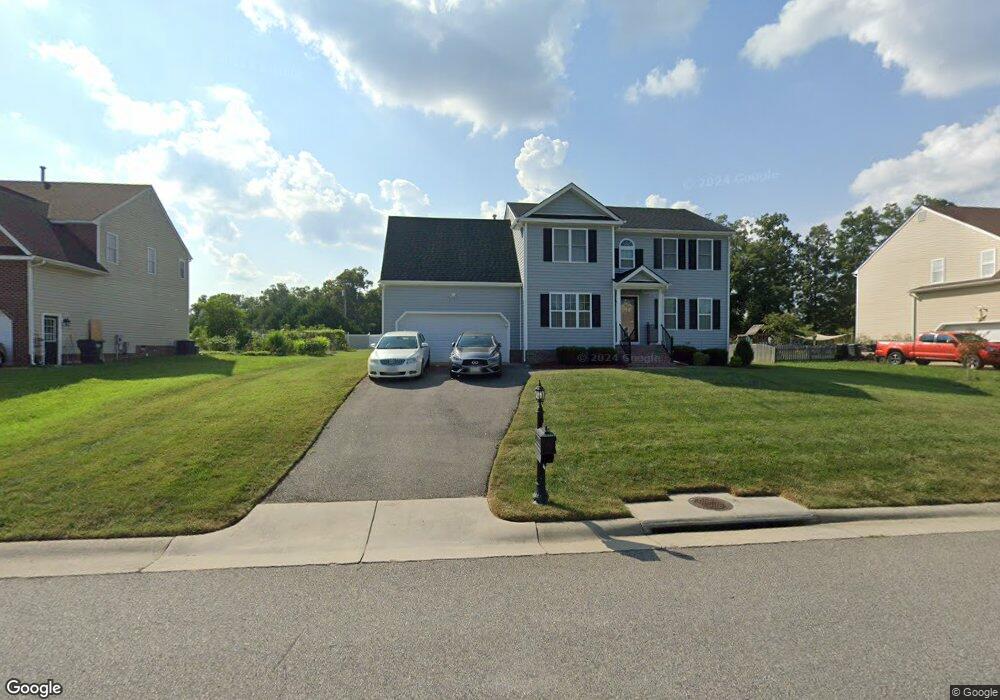
5042 Parrish Branch Rd Midlothian, VA 23112
Estimated Value: $430,000 - $451,000
3
Beds
2
Baths
2,033
Sq Ft
$217/Sq Ft
Est. Value
About This Home
This home is located at 5042 Parrish Branch Rd, Midlothian, VA 23112 and is currently estimated at $441,231, approximately $217 per square foot. 5042 Parrish Branch Rd is a home located in Chesterfield County with nearby schools including Thelma Crenshaw Elementary School, Bailey Bridge Middle School, and Manchester High.
Ownership History
Date
Name
Owned For
Owner Type
Purchase Details
Closed on
Feb 4, 2016
Sold by
Finer Homes Inc A Virginia Corporation
Bought by
Edens Glenn A and Edens Sakinah W
Current Estimated Value
Home Financials for this Owner
Home Financials are based on the most recent Mortgage that was taken out on this home.
Original Mortgage
$248,711
Outstanding Balance
$199,354
Interest Rate
4.12%
Mortgage Type
FHA
Estimated Equity
$241,877
Purchase Details
Closed on
Dec 4, 2015
Sold by
Clay Pointe Development Co Llc A Virgini
Bought by
Finer Homes Inc A Virginia Corporation
Home Financials for this Owner
Home Financials are based on the most recent Mortgage that was taken out on this home.
Original Mortgage
$450,000
Interest Rate
3.83%
Mortgage Type
Land Contract Argmt. Of Sale
Create a Home Valuation Report for This Property
The Home Valuation Report is an in-depth analysis detailing your home's value as well as a comparison with similar homes in the area
Home Values in the Area
Average Home Value in this Area
Purchase History
| Date | Buyer | Sale Price | Title Company |
|---|---|---|---|
| Edens Glenn A | $253,300 | Attorney | |
| Finer Homes Inc A Virginia Corporation | $70,000 | Attorney |
Source: Public Records
Mortgage History
| Date | Status | Borrower | Loan Amount |
|---|---|---|---|
| Open | Edens Glenn A | $248,711 | |
| Previous Owner | Finer Homes Inc A Virginia Corporation | $450,000 |
Source: Public Records
Tax History Compared to Growth
Tax History
| Year | Tax Paid | Tax Assessment Tax Assessment Total Assessment is a certain percentage of the fair market value that is determined by local assessors to be the total taxable value of land and additions on the property. | Land | Improvement |
|---|---|---|---|---|
| 2025 | $3,831 | $427,600 | $70,000 | $357,600 |
| 2024 | $3,831 | $412,200 | $68,000 | $344,200 |
| 2023 | $3,413 | $375,000 | $65,000 | $310,000 |
| 2022 | $3,070 | $333,700 | $60,000 | $273,700 |
| 2021 | $3,066 | $315,800 | $60,000 | $255,800 |
| 2020 | $2,864 | $301,500 | $60,000 | $241,500 |
| 2019 | $2,778 | $292,400 | $60,000 | $232,400 |
| 2018 | $2,605 | $274,200 | $55,000 | $219,200 |
| 2017 | $2,432 | $253,300 | $55,000 | $198,300 |
| 2016 | $528 | $243,800 | $55,000 | $188,800 |
| 2015 | $528 | $55,000 | $55,000 | $0 |
| 2014 | $509 | $53,000 | $53,000 | $0 |
Source: Public Records
Map
Nearby Homes
- 4917 Bailey Woods Ln
- The Rosewood Plan at Cosby Estates
- The Dogwood Plan at Cosby Estates
- The Bradford Plan at Cosby Estates
- The Magnolia Plan at Cosby Estates
- The Busch Plan at Cosby Estates
- The Portsmouth Plan at Cosby Estates
- The Harvick Plan at Cosby Estates
- The Maple Plan at Cosby Estates
- The Azalea Plan at Cosby Estates
- The Hamlin Plan at Cosby Estates
- The Savannah Plan at Cosby Estates
- The Shenandoah Plan at Cosby Estates
- The Audobon Plan at Cosby Estates
- The Burton Plan at Cosby Estates
- 11612 Fort Cosby Dr
- 4706 Parrish Branch Rd
- 11449 Bailey Mountain Trail
- 4524 Glen Tara Dr
- 11701 Clear Ridge Dr
- 5024 Parrish Branch Rd
- 4912 Parrish Branch Rd
- 4918 Parrish Branch Rd
- 11542 Wiltstaff Dr
- 4906 Parrish Branch Rd
- 4913 Parrish Branch Rd
- 5043 Parrish Branch Rd
- 5212 Parrish Branch Rd
- 5230 Parrish Branch Rd
- 5000 Parrish Branch Rd
- 4907 Parrish Branch Rd
- 11536 Wiltstaff Dr
- 11601 Bailey Woods Dr
- 4905 Bailey Woods Ln
- 5006 Parrish Branch Rd
- 4901 Bailey Woods Ln
- 11605 Bailey Woods Dr
- 11543 Wiltstaff Dr
- 4901 Parrish Branch Rd
- 11530 Wiltstaff Dr