Estimated Value: $293,328 - $320,000
3
Beds
1
Bath
1,200
Sq Ft
$259/Sq Ft
Est. Value
About This Home
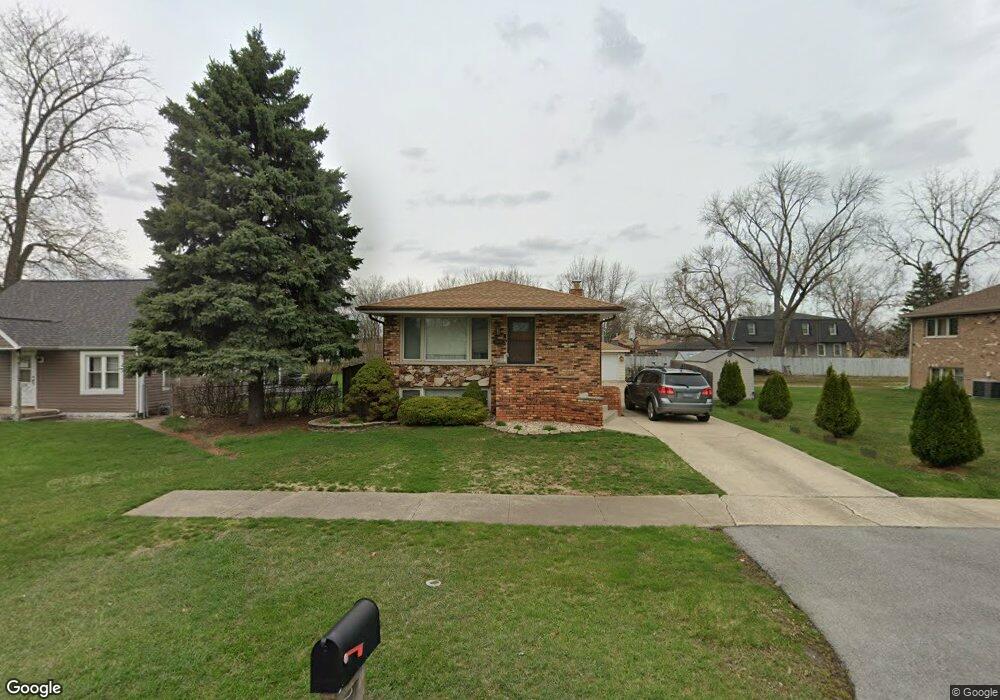
This home is located at 5042 W 119th St, Alsip, IL 60803 and is currently estimated at $310,332, approximately $258 per square foot. 5042 W 119th St is a home located in Cook County with nearby schools including Hazelgreen Elementary School, Prairie Jr High School, and A B Shepard High School.
Ownership History
Date
Name
Owned For
Owner Type
Purchase Details
Closed on
Aug 15, 2006
Sold by
Vogrich Denise K
Bought by
Bugno Denise K
Current Estimated Value
Purchase Details
Closed on
Dec 10, 2001
Sold by
Brynda Donald R
Bought by
Vogrich Danielle L
Home Financials for this Owner
Home Financials are based on the most recent Mortgage that was taken out on this home.
Original Mortgage
$149,150
Interest Rate
6.53%
Purchase Details
Closed on
May 11, 1999
Sold by
Brynda Michelle
Bought by
Brynda Donald R
Home Financials for this Owner
Home Financials are based on the most recent Mortgage that was taken out on this home.
Original Mortgage
$115,000
Interest Rate
6.99%
Purchase Details
Closed on
Jul 28, 1998
Sold by
Stasiof Raymond C and Stafios Helen M
Bought by
Brynda Donald and Brynda Michelle
Home Financials for this Owner
Home Financials are based on the most recent Mortgage that was taken out on this home.
Original Mortgage
$90,000
Interest Rate
7.03%
Create a Home Valuation Report for This Property
The Home Valuation Report is an in-depth analysis detailing your home's value as well as a comparison with similar homes in the area
Home Values in the Area
Average Home Value in this Area
Purchase History
| Date | Buyer | Sale Price | Title Company |
|---|---|---|---|
| Bugno Denise K | $270,000 | 1St American Title | |
| Vogrich Danielle L | $157,000 | -- | |
| Brynda Donald R | -- | First American Title | |
| Brynda Donald | $143,000 | -- |
Source: Public Records
Mortgage History
| Date | Status | Borrower | Loan Amount |
|---|---|---|---|
| Previous Owner | Vogrich Danielle L | $149,150 | |
| Previous Owner | Brynda Donald R | $115,000 | |
| Previous Owner | Brynda Donald | $90,000 |
Source: Public Records
Tax History Compared to Growth
Tax History
| Year | Tax Paid | Tax Assessment Tax Assessment Total Assessment is a certain percentage of the fair market value that is determined by local assessors to be the total taxable value of land and additions on the property. | Land | Improvement |
|---|---|---|---|---|
| 2024 | $5,197 | $19,000 | $4,050 | $14,950 |
| 2023 | $5,281 | $19,000 | $4,050 | $14,950 |
| 2022 | $5,281 | $16,571 | $3,544 | $13,027 |
| 2021 | $5,058 | $16,570 | $3,543 | $13,027 |
| 2020 | $5,086 | $16,570 | $3,543 | $13,027 |
| 2019 | $4,551 | $15,047 | $3,206 | $11,841 |
| 2018 | $4,379 | $15,047 | $3,206 | $11,841 |
| 2017 | $4,433 | $15,047 | $3,206 | $11,841 |
| 2016 | $4,151 | $13,205 | $2,700 | $10,505 |
| 2015 | $4,070 | $13,205 | $2,700 | $10,505 |
| 2014 | $3,949 | $13,205 | $2,700 | $10,505 |
| 2013 | $4,231 | $14,952 | $2,700 | $12,252 |
Source: Public Records
Map
Nearby Homes
- 11841 S Leamington Ave
- 11756 S Leamington Ave
- 11906 S Cicero Ave
- 11601 S Lawler Ave
- 11608 S Leamington Ave
- 5008 W 122nd St Unit 2B
- 12147 S Cicero Ave
- 5311 W Mint Julip Dr Unit 301
- 12211 S Spencer St
- 4808 W 118th St
- 4804 W 118th St
- 11553 S Joalyce Dr
- 11534 S Lee Rd
- 4511 W Howdy Ln
- 4833 W 123rd Place
- 5128 W 113th St
- 5118 W 112th Place
- 11558 S Kolmar Ave
- 11604 S Kenneth Ave
- 11156 S Lawler Ave
- 5046 W 119th St
- 11854 S Lawler Ave
- 11850 S Lawler Ave
- 13400 S Leclaire Ave
- 13515 S Leclaire Ave
- 13515 S Leclaire Ave Unit 55
- 5103 W 119th St
- 11821 S Leclaire Ave
- 11840 S Leclaire Ave
- 5100 W 119th St
- 5100 W 119th St
- 5107 W 119th St
- 11846 S Lawler Ave
- 11836 S Leclaire Ave
- 11836A S Leclaire Ave
- 11836 S Leclaire Ave
- 11836B S Leclaire Ave
- 11817 S Leclaire Ave
- 5111 W 119th St
- 5030 W 119th St