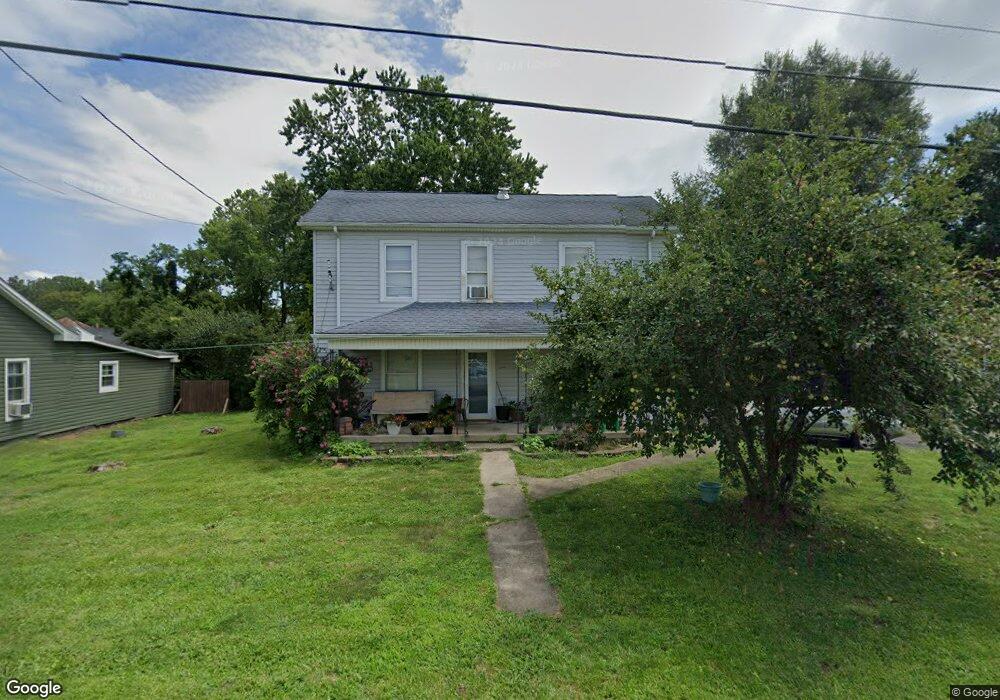
5044 Huston Rd Collinsville, OH 45004
Milford Township NeighborhoodEstimated Value: $140,000 - $271,000
4
Beds
2
Baths
2,256
Sq Ft
$102/Sq Ft
Est. Value
About This Home
This home is located at 5044 Huston Rd, Collinsville, OH 45004 and is currently estimated at $230,899, approximately $102 per square foot. 5044 Huston Rd is a home located in Butler County with nearby schools including Talawanda Middle School and Talawanda High School.
Ownership History
Date
Name
Owned For
Owner Type
Purchase Details
Closed on
Jul 17, 2009
Sold by
Estate Of Jesse Bryant Jr
Bought by
Bryant Velma J
Current Estimated Value
Purchase Details
Closed on
Nov 14, 2007
Sold by
The Bank Of New York Trust Co Na
Bought by
Bryant Velma J and Bryant Jesse
Home Financials for this Owner
Home Financials are based on the most recent Mortgage that was taken out on this home.
Original Mortgage
$69,900
Interest Rate
6.31%
Mortgage Type
Purchase Money Mortgage
Purchase Details
Closed on
Aug 21, 2007
Sold by
Senften Michael S
Bought by
The Bank Of New York Co Na and Jpmorgan Chase Bank Na
Purchase Details
Closed on
Dec 19, 1995
Sold by
Fields Charles L
Bought by
Senften Michael S and Senften Angela
Home Financials for this Owner
Home Financials are based on the most recent Mortgage that was taken out on this home.
Original Mortgage
$82,311
Interest Rate
7.45%
Mortgage Type
FHA
Create a Home Valuation Report for This Property
The Home Valuation Report is an in-depth analysis detailing your home's value as well as a comparison with similar homes in the area
Home Values in the Area
Average Home Value in this Area
Purchase History
| Date | Buyer | Sale Price | Title Company |
|---|---|---|---|
| Bryant Velma J | -- | None Available | |
| Bryant Velma J | $69,900 | Accutitle Agency Inc | |
| The Bank Of New York Co Na | $85,000 | None Available | |
| Senften Michael S | $83,000 | -- |
Source: Public Records
Mortgage History
| Date | Status | Borrower | Loan Amount |
|---|---|---|---|
| Previous Owner | Bryant Velma J | $69,900 | |
| Previous Owner | Senften Michael S | $82,311 |
Source: Public Records
Tax History Compared to Growth
Tax History
| Year | Tax Paid | Tax Assessment Tax Assessment Total Assessment is a certain percentage of the fair market value that is determined by local assessors to be the total taxable value of land and additions on the property. | Land | Improvement |
|---|---|---|---|---|
| 2024 | $2,058 | $57,640 | $10,470 | $47,170 |
| 2023 | $2,047 | $57,640 | $10,470 | $47,170 |
| 2022 | $1,594 | $40,300 | $10,470 | $29,830 |
| 2021 | $1,519 | $40,300 | $10,470 | $29,830 |
| 2020 | $1,587 | $40,300 | $10,470 | $29,830 |
| 2019 | $2,554 | $32,680 | $9,700 | $22,980 |
| 2018 | $1,354 | $32,680 | $9,700 | $22,980 |
| 2017 | $1,260 | $32,680 | $9,700 | $22,980 |
| 2016 | $1,170 | $29,360 | $9,700 | $19,660 |
| 2015 | $1,190 | $29,360 | $9,700 | $19,660 |
| 2014 | $1,085 | $29,360 | $9,700 | $19,660 |
| 2013 | $1,085 | $26,260 | $9,700 | $16,560 |
Source: Public Records
Map
Nearby Homes
- 5115 & 5123 Hamilton Eaton Rd
- 5115 Hamilton Eaton Rd
- 5123 Hamilton Eaton Rd
- 2062 Oxford Trenton Rd
- 3 Ac Hamilton Eaton Rd
- 4336 Huston Rd
- 4411 Eaton Rd
- 1753 Scott Rd
- 0 Trenton Oxford Rd Unit 1845432
- 1004 Oxford Middletown Rd
- 3550 Oxford-Middletown
- 2280 Harris Rd
- 4719 Hamilton Richmond Rd
- 3285 Hamilton Richmond Rd
- C Hamilton Richmond Rd
- B Hamilton Richmond Rd
- 2680 Somerville Rd
- 6711 Neanover Rd
- 3951 W Elkton Rd
- 4025 Darrtown Rd
- 5058 Huston Rd
- 5028 Huston Rd
- 5114 Huston Rd
- 5087 Hamilton Eaton Rd
- 5012 Huston Rd
- 5079 Hamilton Eaton Rd
- 2 State & Oxford Unit 2
- 5126 Huston Rd
- 5069 Hamilton Eaton Rd
- 5117 Huston Rd
- 4980 Huston Rd
- 5094 Hamilton Eaton Rd
- 5086 Hamilton Eaton Rd
- 5059 Hamilton Eaton Rd
- 5100 Hamilton Eaton Rd
- 5138 Huston Rd
- 5118 S Hamilton Eaton Rd
- 5147 Huston Rd
- 5147 Huston Rd
- 5108 Hamilton Eaton Rd