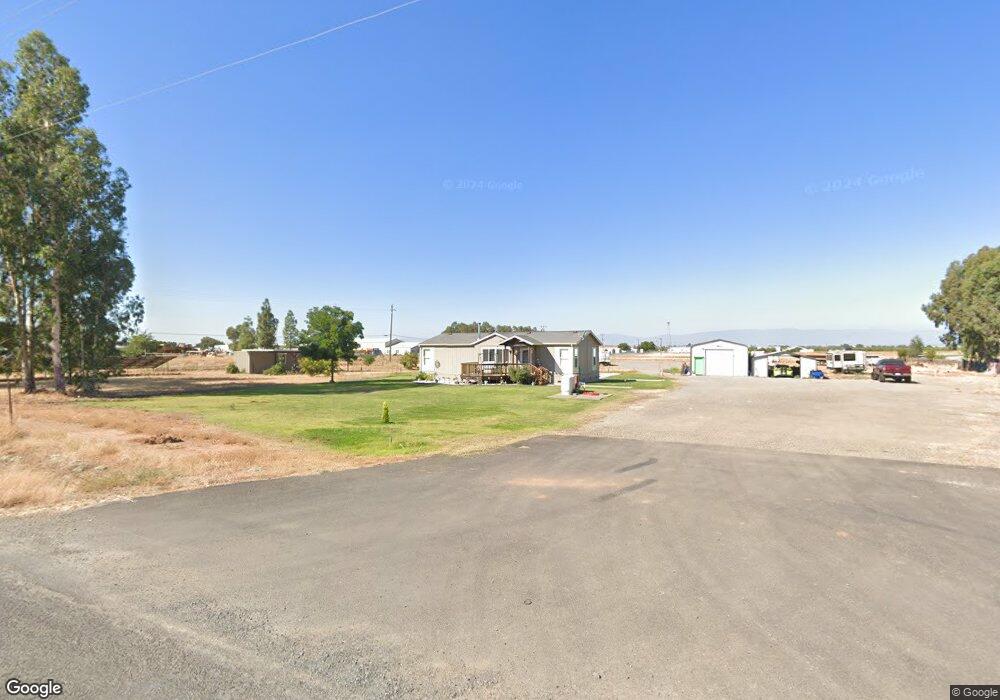
5045 Olive Rd Corning, CA 96021
Estimated Value: $327,000 - $449,000
About This Home
This home is located at 5045 Olive Rd, Corning, CA 96021 and is currently estimated at $395,275, approximately $332 per square foot. 5045 Olive Rd is a home located in Tehama County with nearby schools including Olive View Elementary School, Maywood Middle School, and Corning High School.
Ownership History
We collect this data history from publicly available records. To have your information removed, we recommend requesting removal directly through your county’s website.
Purchase Details
Purchase Details
Home Financials for this Owner
Home Financials are based on the most recent Mortgage that was taken out on this home.Purchase Details
Purchase Details
Purchase Details
Home Financials for this Owner
Home Financials are based on the most recent Mortgage that was taken out on this home.Purchase Details
Home Financials for this Owner
Home Financials are based on the most recent Mortgage that was taken out on this home.Purchase History
We collect this data history from publicly available records. To have your information removed, we recommend requesting removal directly through your county’s website.
| Date | Buyer | Sale Price | Title Company |
|---|---|---|---|
| -- | None Available | ||
| $232,500 | Placer Title Company | ||
| -- | First American Title Company | ||
| $175,000 | Northern California Title Co | ||
| -- | Northern California Title Co | ||
| $35,000 | Northern California Title Co |
Mortgage History
We collect this data history from publicly available records. To have your information removed, we recommend requesting removal directly through your county’s website.
| Date | Status | Borrower | Loan Amount |
|---|---|---|---|
| Previous Owner | $228,288 | ||
| Previous Owner | $80,000 | ||
| Previous Owner | $30,000 |
Tax History
We collect this data history from publicly available records. To have your information removed, we recommend requesting removal directly through your county’s website.
| Year | Tax Paid | Tax Assessment Tax Assessment Total Assessment is a certain percentage of the fair market value that is determined by local assessors to be the total taxable value of land and additions on the property. | Land | Improvement |
|---|---|---|---|---|
| 2025 | $3,561 | $351,276 | $116,056 | $235,220 |
| 2023 | $2,958 | $288,355 | $111,550 | $176,805 |
| 2022 | $2,952 | $286,170 | $109,363 | $176,807 |
| 2021 | $2,516 | $249,285 | $107,219 | $142,066 |
| 2020 | $2,542 | $246,730 | $106,120 | $140,610 |
| 2019 | $2,436 | $241,893 | $104,040 | $137,853 |
| 2018 | $2,513 | $237,150 | $102,000 | $135,150 |
| 2017 | $1,791 | $166,641 | $46,186 | $120,455 |
| 2016 | $1,622 | $158,706 | $43,987 | $114,719 |
| 2015 | -- | $158,706 | $43,987 | $114,719 |
| 2014 | $1,427 | $138,006 | $38,250 | $99,756 |
Map
- 0 N Marguerite Ave
- 0 State Highway 99w
- 0 Mary Ave Unit SN25184944
- 565 North St
- 265 Mclane Cir
- 573 North St
- 454 Del Norte Ave
- 577 North St
- 631 North St
- 633 North St
- 635 North St
- 505 Marguerite Ave
- 5068 Woodson Ave
- 803 Tehama St
- 803 Colusa St
- 519 Solano St
- 409 4th St
- 617 Solano St
- 455 Clear Creek St
- 1547 Blackburn Ave
Ask me questions while you tour the home.