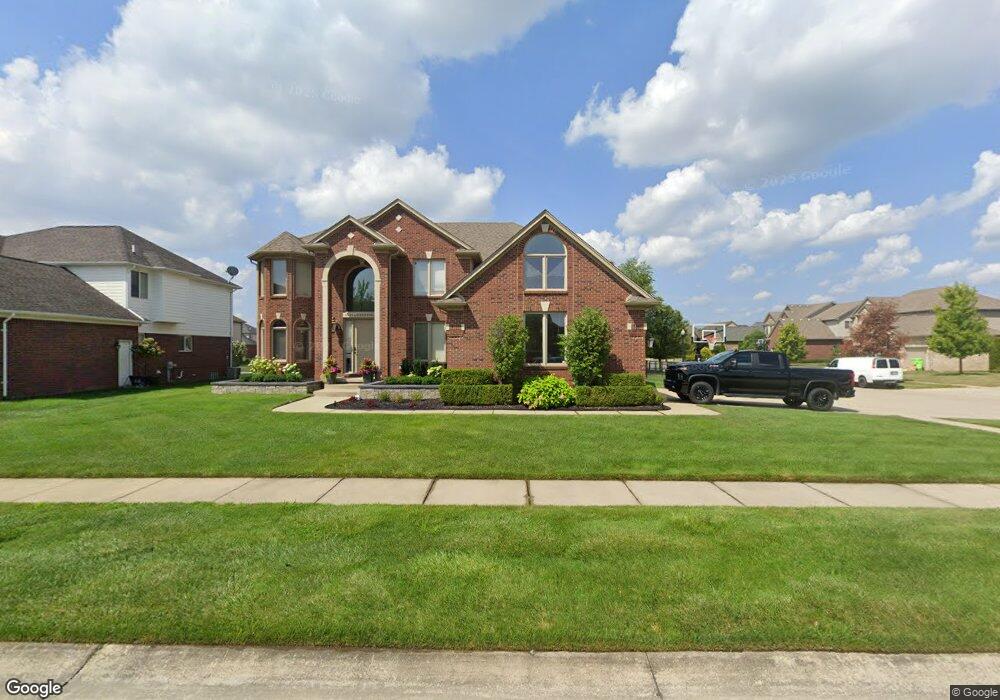
50459 Ashperton Dr Macomb, MI 48044
Estimated Value: $598,772 - $680,000
--
Bed
3
Baths
3,453
Sq Ft
$186/Sq Ft
Est. Value
About This Home
This home is located at 50459 Ashperton Dr, Macomb, MI 48044 and is currently estimated at $641,193, approximately $185 per square foot. 50459 Ashperton Dr is a home located in Macomb County with nearby schools including Shawnee Elementary School, Seneca Middle School, and Dakota High School.
Ownership History
Date
Name
Owned For
Owner Type
Purchase Details
Closed on
Sep 14, 2017
Sold by
Vittorini Antonio and Vittorini Evita
Bought by
Lanitelli Joseph F and Lanitelli Melissa
Current Estimated Value
Home Financials for this Owner
Home Financials are based on the most recent Mortgage that was taken out on this home.
Original Mortgage
$304,000
Outstanding Balance
$164,117
Interest Rate
3.93%
Mortgage Type
Purchase Money Mortgage
Estimated Equity
$477,076
Purchase Details
Closed on
May 26, 2009
Sold by
Vittorini Antonio R and Vittorini Evita
Bought by
Vittorini Antonio R and Vittorini Evita
Purchase Details
Closed on
Oct 27, 2008
Sold by
Gtr Builders Inc
Bought by
Malibu Homes Inc
Purchase Details
Closed on
Feb 29, 2008
Sold by
Gtr Builders Inc
Bought by
Aviano Building Co Inc
Create a Home Valuation Report for This Property
The Home Valuation Report is an in-depth analysis detailing your home's value as well as a comparison with similar homes in the area
Home Values in the Area
Average Home Value in this Area
Purchase History
| Date | Buyer | Sale Price | Title Company |
|---|---|---|---|
| Lanitelli Joseph F | $390,000 | Etitle Agency Inc | |
| Vittorini Antonio R | -- | None Available | |
| Malibu Homes Inc | $30,000 | Greco | |
| Aviano Building Co Inc | $70,000 | Greco | |
| Evita Vittorini Antonio R | $100,000 | Greco |
Source: Public Records
Mortgage History
| Date | Status | Borrower | Loan Amount |
|---|---|---|---|
| Open | Lanitelli Joseph F | $304,000 |
Source: Public Records
Tax History Compared to Growth
Tax History
| Year | Tax Paid | Tax Assessment Tax Assessment Total Assessment is a certain percentage of the fair market value that is determined by local assessors to be the total taxable value of land and additions on the property. | Land | Improvement |
|---|---|---|---|---|
| 2025 | $7,755 | $304,700 | $0 | $0 |
| 2024 | $5,865 | $291,300 | $0 | $0 |
| 2023 | $5,563 | $261,200 | $0 | $0 |
| 2022 | $7,026 | $231,400 | $0 | $0 |
| 2021 | $6,825 | $216,100 | $0 | $0 |
| 2020 | $5,104 | $211,400 | $0 | $0 |
| 2019 | $6,056 | $196,400 | $0 | $0 |
| 2018 | $5,926 | $185,400 | $0 | $0 |
| 2017 | $4,974 | $173,160 | $34,500 | $138,660 |
| 2016 | $4,689 | $173,160 | $0 | $0 |
| 2015 | $4,668 | $163,440 | $0 | $0 |
| 2014 | $4,668 | $148,650 | $23,500 | $125,150 |
| 2011 | $869 | $142,630 | $20,500 | $122,130 |
Source: Public Records
Map
Nearby Homes
- 50247 Cheltenham Dr
- 50100 Victoria Place
- 20488 W Kilburn Dr
- 20352 Banbury Ct
- 50635 Beckett Ct
- 20847 23 Mile Rd
- 50585 Crusader Dr
- 50632 Crusader Dr
- 20569 W Kilburn Dr
- 50664 Crusader Dr
- 20505 W Kilburn Dr
- 50533 Crusader Dr
- 50696 Crusader Dr
- 46425 E Via Lucca Unit 12
- 50617 Crusader Dr
- 50600 Koss Dr
- 49620 Dunhill Dr
- 21349 Course Dr
- 21478 Sabrina Dr
- 49472 Helmsley Dr
- 50431 Ashperton Dr
- 50472 Nantwich Dr
- 50444 Nantwich Dr
- 50403 Ashperton Dr
- 20845 Cheddleton Dr
- 20823 Cheddleton Dr
- 20867 Cheddleton Dr
- 50416 Nantwich Dr
- 50440 Ashperton Dr
- 50375 Ashperton Dr
- 50384 Ashperton Dr
- 20889 Cheddleton Dr
- 20801 Cheddleton Dr
- 50412 Ashperton Dr
- 20779 Cheddleton Dr
- 50356 Ashperton Dr
- 50347 Ashperton Dr
- 20842 Stalybridge Dr
- 20820 Stalybridge Dr
- 50457 Nantwich Dr