5046 Fallen Oaks Dr Houston, TX 77091
Oak Forest-Garden Oaks NeighborhoodEstimated Value: $507,435 - $788,000
4
Beds
3
Baths
4,576
Sq Ft
$140/Sq Ft
Est. Value
About This Home
This home is located at 5046 Fallen Oaks Dr, Houston, TX 77091 and is currently estimated at $639,109, approximately $139 per square foot. 5046 Fallen Oaks Dr is a home located in Harris County with nearby schools including Clifton Middle, Scarborough High School, and Southwest Schools Mangum El Campus.
Ownership History
Date
Name
Owned For
Owner Type
Purchase Details
Closed on
Jan 10, 1997
Sold by
Lanier Kenneth E
Bought by
Lanier Gloria E
Current Estimated Value
Purchase Details
Closed on
Feb 13, 1996
Sold by
Chapin Richard Burbank and Chapin Mildred Catherine Friedrich
Bought by
Lanier Kenneth E and Lanier Gloria E
Home Financials for this Owner
Home Financials are based on the most recent Mortgage that was taken out on this home.
Original Mortgage
$110,000
Interest Rate
7.08%
Purchase Details
Closed on
Dec 2, 1994
Sold by
Lanier Kenneth E and Lanier Gloria E
Bought by
Chapin Richard Burbank and Chapin Mildred Catherine Friedrich
Home Financials for this Owner
Home Financials are based on the most recent Mortgage that was taken out on this home.
Original Mortgage
$110,000
Interest Rate
9.07%
Mortgage Type
Seller Take Back
Create a Home Valuation Report for This Property
The Home Valuation Report is an in-depth analysis detailing your home's value as well as a comparison with similar homes in the area
Home Values in the Area
Average Home Value in this Area
Purchase History
| Date | Buyer | Sale Price | Title Company |
|---|---|---|---|
| Lanier Gloria E | -- | -- | |
| Lanier Kenneth E | -- | -- | |
| Chapin Richard Burbank | -- | -- |
Source: Public Records
Mortgage History
| Date | Status | Borrower | Loan Amount |
|---|---|---|---|
| Previous Owner | Lanier Kenneth E | $110,000 | |
| Previous Owner | Chapin Richard Burbank | $110,000 | |
| Closed | Lanier Gloria E | $0 |
Source: Public Records
Tax History Compared to Growth
Tax History
| Year | Tax Paid | Tax Assessment Tax Assessment Total Assessment is a certain percentage of the fair market value that is determined by local assessors to be the total taxable value of land and additions on the property. | Land | Improvement |
|---|---|---|---|---|
| 2025 | $228 | $341,205 | $126,693 | $214,512 |
| 2024 | $228 | $343,786 | $126,693 | $217,093 |
| 2023 | $228 | $361,516 | $111,788 | $249,728 |
| 2022 | $6,795 | $332,798 | $111,788 | $221,010 |
| 2021 | $6,539 | $280,554 | $74,525 | $206,029 |
| 2020 | $6,203 | $270,329 | $74,525 | $195,804 |
| 2019 | $5,892 | $250,744 | $74,525 | $176,219 |
| 2018 | $1,445 | $211,692 | $74,525 | $137,167 |
| 2017 | $6,243 | $246,906 | $74,525 | $172,381 |
| 2016 | $5,838 | $230,900 | $74,525 | $156,375 |
| 2015 | $1,943 | $229,513 | $74,525 | $154,988 |
| 2014 | $1,943 | $204,870 | $52,168 | $152,702 |
Source: Public Records
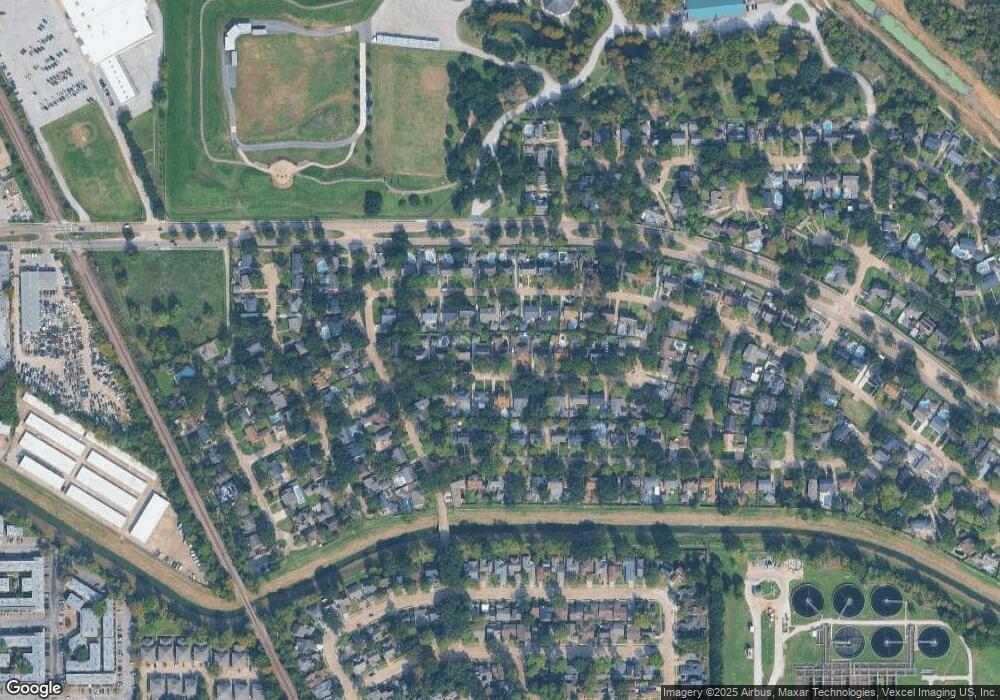
Map
Nearby Homes
- 5010 Oak Shadows Dr
- 5610 Oak Trail Ln
- 5511 Oak Trail Ln
- 5451 Oakhaven Ln
- 4906 Droddy St
- 5670 Birchmont Dr Unit C
- 5114 Golden Forest Dr Unit B
- 5036 Golden Forest Dr
- 5018 Golden Forest Dr
- 5016 Golden Forest Dr
- 5014 Golden Forest Dr
- 5013 Golden Forest Dr
- 5662 Birchmont Dr Unit A
- 5116 Creekmont Dr
- 5036 Creekmont Dr
- 5666 Birchmont Dr Unit 3
- 5667 Birchmont Dr Unit H
- 5667 Birchmont Dr Unit A
- 4923 Golden Forest Dr
- 4923 Golden Forest Dr Unit A
- 5050 Fallen Oaks Dr
- 5042 Fallen Oaks Dr
- 5031 Bayou Vista Dr
- 5035 Bayou Vista Dr
- 5054 Fallen Oaks Dr
- 5038 Fallen Oaks Dr
- 5027 Bayou Vista Dr
- 5039 Bayou Vista Dr
- 5047 Fallen Oaks Dr
- 5051 Fallen Oaks Dr
- 5043 Fallen Oaks Dr
- 5058 Fallen Oaks Dr
- 5034 Fallen Oaks Dr
- 5043 Bayou Vista Dr
- 5055 Fallen Oaks Dr
- 5039 Fallen Oaks Dr
- 5019 Bayou Vista Dr
- 5059 Fallen Oaks Dr
- 5047 Bayou Vista Dr
- 5030 Fallen Oaks Dr