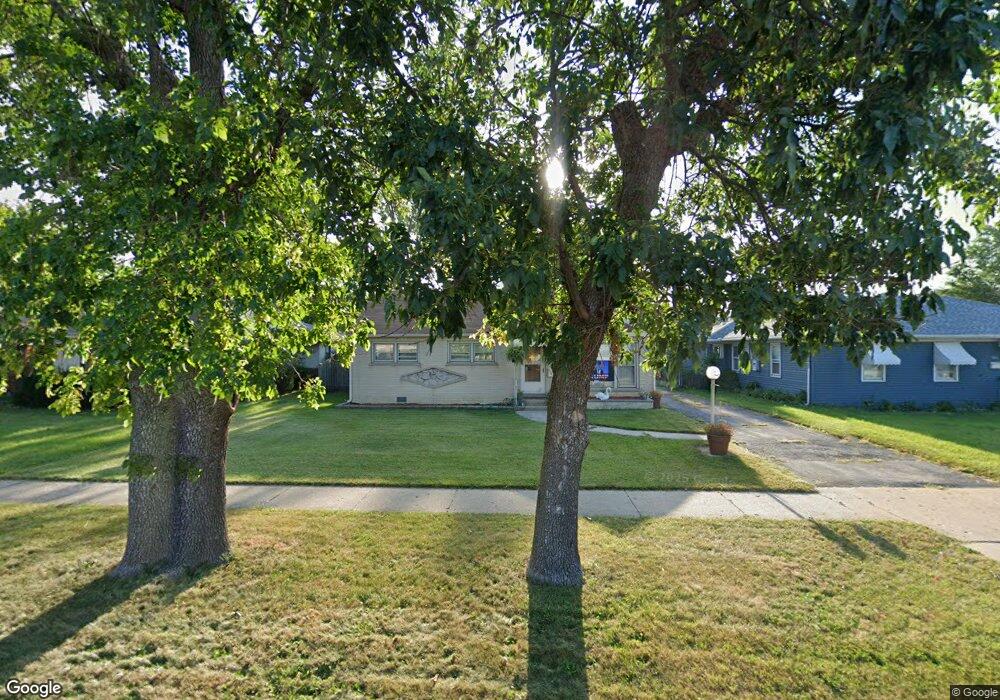
5047 N Cumberland Ave Norridge, IL 60706
Estimated Value: $323,000 - $363,000
3
Beds
1
Bath
1,009
Sq Ft
$339/Sq Ft
Est. Value
About This Home
This home is located at 5047 N Cumberland Ave, Norridge, IL 60706 and is currently estimated at $341,636, approximately $338 per square foot. 5047 N Cumberland Ave is a home located in Cook County with nearby schools including J Leigh Elementary School, Ridgewood Community High School, and St Eugene School.
Ownership History
Date
Name
Owned For
Owner Type
Purchase Details
Closed on
Apr 16, 2018
Sold by
Larucci Nicholas
Bought by
Larucci Nicholas and Larucci Nick P
Current Estimated Value
Purchase Details
Closed on
Jul 2, 1999
Sold by
Schwager David W and Schwager Frances
Bought by
Larucci Nicholas
Purchase Details
Closed on
Jan 25, 1999
Sold by
Calefati John and Schwager Frances
Bought by
Schwager David W and Schwager Frances
Home Financials for this Owner
Home Financials are based on the most recent Mortgage that was taken out on this home.
Original Mortgage
$144,350
Interest Rate
6.81%
Mortgage Type
Balloon
Purchase Details
Closed on
Sep 18, 1995
Sold by
Grabe Isabel and Grabe Isabel K
Bought by
Calefati Frances and Calefati John
Home Financials for this Owner
Home Financials are based on the most recent Mortgage that was taken out on this home.
Original Mortgage
$135,000
Interest Rate
7.87%
Create a Home Valuation Report for This Property
The Home Valuation Report is an in-depth analysis detailing your home's value as well as a comparison with similar homes in the area
Home Values in the Area
Average Home Value in this Area
Purchase History
| Date | Buyer | Sale Price | Title Company |
|---|---|---|---|
| Larucci Nicholas | -- | Attorney | |
| Larucci Nicholas | $170,000 | -- | |
| Schwager David W | -- | -- | |
| Calefati Frances | $150,000 | -- |
Source: Public Records
Mortgage History
| Date | Status | Borrower | Loan Amount |
|---|---|---|---|
| Previous Owner | Schwager David W | $144,350 | |
| Previous Owner | Calefati Frances | $135,000 |
Source: Public Records
Tax History Compared to Growth
Tax History
| Year | Tax Paid | Tax Assessment Tax Assessment Total Assessment is a certain percentage of the fair market value that is determined by local assessors to be the total taxable value of land and additions on the property. | Land | Improvement |
|---|---|---|---|---|
| 2024 | $1,001 | $25,526 | $13,026 | $12,500 |
| 2023 | $1,007 | $25,526 | $13,026 | $12,500 |
| 2022 | $1,007 | $25,526 | $13,026 | $12,500 |
| 2021 | $1,110 | $23,047 | $11,523 | $11,524 |
| 2020 | $1,007 | $23,047 | $11,523 | $11,524 |
| 2019 | $987 | $25,866 | $11,523 | $14,343 |
| 2018 | $1,149 | $22,223 | $9,519 | $12,704 |
| 2017 | $1,101 | $22,223 | $9,519 | $12,704 |
| 2016 | $1,600 | $22,223 | $9,519 | $12,704 |
| 2015 | $1,823 | $20,059 | $8,266 | $11,793 |
| 2014 | $1,758 | $20,059 | $8,266 | $11,793 |
| 2013 | $1,763 | $20,059 | $8,266 | $11,793 |
Source: Public Records
Map
Nearby Homes
- 8500 W Carmen Ave
- 8517 W Carmen Ave
- 8542 W Winnemac Ave
- 8540 W Foster Ave Unit 605
- 8540 W Foster Ave Unit 504
- 8268 W Lawrence Ave
- 8631 W Foster Ave
- 4846 N Crescent Ave
- 5348 N Cumberland Ave Unit 204
- 5348 N Cumberland Ave Unit 206
- 5323 N Delphia Ave Unit 323
- 8344 W Catherine Ave
- 5349 N Delphia Ave Unit 250
- 5349 N Delphia Ave Unit 150
- 8024 W Charmaine Rd
- 8646 W Berwyn Ave Unit 1N
- 8340 W Balmoral Ave
- 8622 W Summerdale Ave
- 5117 N East River Rd Unit 1A
- 8231 W Balmoral Ave
- 5041 N Cumberland Ave
- 5053 N Cumberland Ave
- 5101 N Cumberland Ave
- 8341 W Carmen Ave
- 8340 W Winnemac Ave
- 5027 N Cumberland Ave
- 5109 N Cumberland Ave
- 8331 W Carmen Ave
- 8330 W Winnemac Ave
- 8340 W Carmen Ave
- 5021 N Cumberland Ave
- 8341 W Winnemac Ave
- 8321 W Carmen Ave
- 8320 W Winnemac Ave
- 5015 N Cumberland Ave
- 5125 N Cumberland Ave
- 8330 W Carmen Ave
- 8331 W Winnemac Ave
- 5007 N Cumberland Ave
- 8311 W Carmen Ave