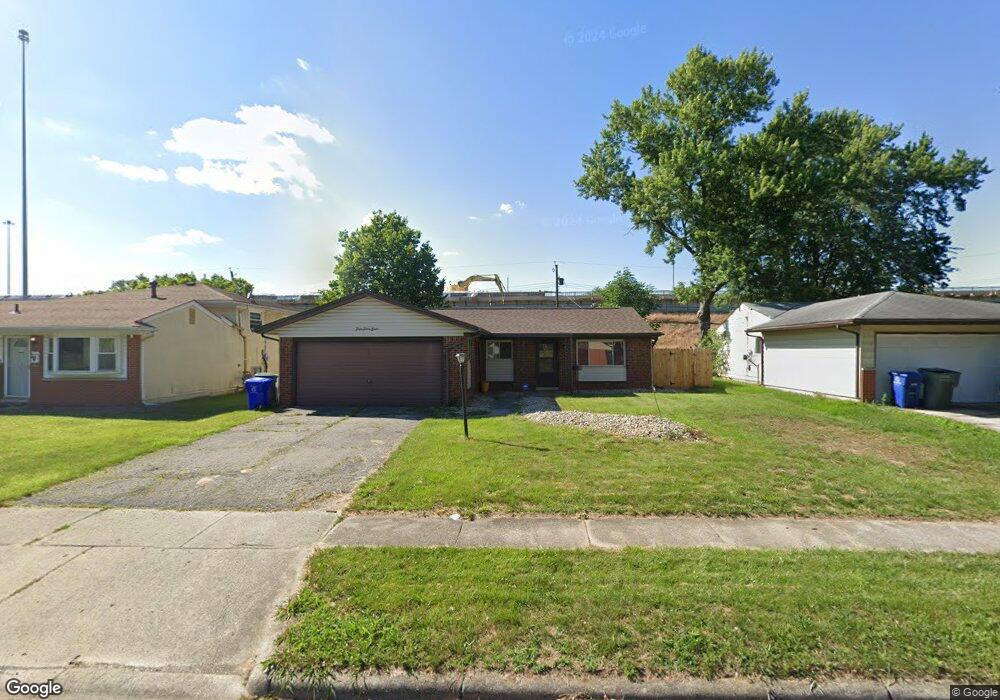
5048 Botsford Dr Columbus, OH 43232
Walnut Heights NeighborhoodEstimated Value: $186,000 - $225,000
3
Beds
1
Bath
1,239
Sq Ft
$166/Sq Ft
Est. Value
About This Home
This home is located at 5048 Botsford Dr, Columbus, OH 43232 and is currently estimated at $205,682, approximately $166 per square foot. 5048 Botsford Dr is a home located in Franklin County with nearby schools including Liberty Elementary School, Yorktown Middle School, and Independence High School.
Ownership History
Date
Name
Owned For
Owner Type
Purchase Details
Closed on
Aug 20, 2008
Sold by
Va
Bought by
Head Mary E
Current Estimated Value
Home Financials for this Owner
Home Financials are based on the most recent Mortgage that was taken out on this home.
Original Mortgage
$67,763
Outstanding Balance
$44,952
Interest Rate
6.55%
Mortgage Type
FHA
Estimated Equity
$160,730
Purchase Details
Closed on
Apr 2, 2008
Sold by
Kanode Carolyn and Countrywide Home Loans Inc
Bought by
Va
Purchase Details
Closed on
Nov 18, 2005
Sold by
Branch Marianne
Bought by
Kanode Carolyn
Home Financials for this Owner
Home Financials are based on the most recent Mortgage that was taken out on this home.
Original Mortgage
$93,978
Interest Rate
6.17%
Mortgage Type
VA
Purchase Details
Closed on
Mar 28, 1996
Sold by
Mcatee Donald C
Bought by
Branch Charles R and Branch Marianne
Purchase Details
Closed on
Oct 1, 1986
Purchase Details
Closed on
Jun 1, 1979
Create a Home Valuation Report for This Property
The Home Valuation Report is an in-depth analysis detailing your home's value as well as a comparison with similar homes in the area
Home Values in the Area
Average Home Value in this Area
Purchase History
| Date | Buyer | Sale Price | Title Company |
|---|---|---|---|
| Head Mary E | -- | Talon Group | |
| Va | $56,000 | None Available | |
| Kanode Carolyn | $92,000 | Title First | |
| Branch Charles R | $65,324 | -- | |
| -- | $53,000 | -- | |
| -- | $42,000 | -- |
Source: Public Records
Mortgage History
| Date | Status | Borrower | Loan Amount |
|---|---|---|---|
| Open | Head Mary E | $67,763 | |
| Previous Owner | Kanode Carolyn | $93,978 |
Source: Public Records
Tax History Compared to Growth
Tax History
| Year | Tax Paid | Tax Assessment Tax Assessment Total Assessment is a certain percentage of the fair market value that is determined by local assessors to be the total taxable value of land and additions on the property. | Land | Improvement |
|---|---|---|---|---|
| 2024 | $2,826 | $62,970 | $19,250 | $43,720 |
| 2023 | $2,790 | $62,965 | $19,250 | $43,715 |
| 2022 | $1,759 | $33,920 | $6,790 | $27,130 |
| 2021 | $1,762 | $33,920 | $6,790 | $27,130 |
| 2020 | $1,765 | $33,920 | $6,790 | $27,130 |
| 2019 | $1,724 | $28,420 | $5,670 | $22,750 |
| 2018 | $1,599 | $28,420 | $5,670 | $22,750 |
| 2017 | $1,723 | $28,420 | $5,670 | $22,750 |
| 2016 | $1,628 | $24,570 | $4,690 | $19,880 |
| 2015 | $1,477 | $24,570 | $4,690 | $19,880 |
| 2014 | $1,481 | $24,570 | $4,690 | $19,880 |
| 2013 | $812 | $27,300 | $5,215 | $22,085 |
Source: Public Records
Map
Nearby Homes
- 5144 Botsford Dr
- 5123 Jameson Dr
- 2447 Maybury Rd
- 5061 Labelle Dr
- 5114 Carbondale Dr
- 2173 Noe Bixby Rd
- 0 Noe Bixby Rd
- 5268 Carbondale Dr
- 2615 Carbondale Place
- 2342 Noe Bixby Rd
- 2336 Noe Bixby Rd
- 2360 Noe Bixby Rd
- 2354 Noe Bixby Rd
- 2348 Noe Bixby Rd
- 2150 Noe Bixby Rd
- 2651 Brownfield Rd
- 2705 Denmark Rd
- 5194 Orlando Ct
- 5011 Refugee Rd
- 5278 Glenbriar Ct
- 5056 Botsford Dr
- 5042 Botsford Dr
- 5034 Botsford Dr
- 5028 Botsford Dr
- 5054 Jameson Dr
- 5070 Botsford Dr
- 5059 Botsford Dr
- 5073 Botsford Dr
- 5029 Botsford Dr
- 5020 Botsford Dr
- 5055 Jameson Dr
- 5078 Botsford Dr
- 5025 Botsford Dr
- 5063 Jameson Dr
- 5012 Botsford Dr
- 5089 Botsford Dr
- 5084 Botsford Dr
- 2378 Lisbon Dr
- 5074 Jameson Dr
- 5069 Jameson Dr