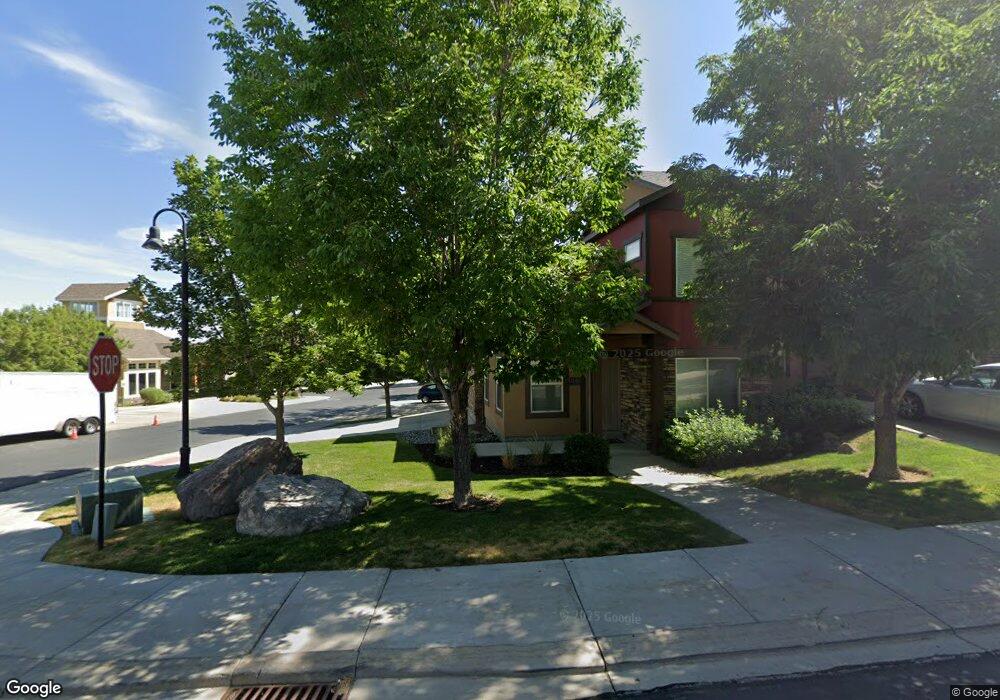
5048 Slate St Herriman, UT 84096
Estimated Value: $338,000 - $358,846
2
Beds
2
Baths
1,067
Sq Ft
$328/Sq Ft
Est. Value
About This Home
This home is located at 5048 Slate St, Herriman, UT 84096 and is currently estimated at $350,212, approximately $328 per square foot. 5048 Slate St is a home located in Salt Lake County with nearby schools including Foothills School, South Hills Middle School, and Mountain Ridge High School.
Ownership History
Date
Name
Owned For
Owner Type
Purchase Details
Closed on
Nov 26, 2024
Sold by
Wilkinson Danielle and Arguello Danielle
Bought by
Nielsen-Bell Landon
Current Estimated Value
Home Financials for this Owner
Home Financials are based on the most recent Mortgage that was taken out on this home.
Original Mortgage
$310,500
Outstanding Balance
$307,889
Interest Rate
6.44%
Mortgage Type
New Conventional
Estimated Equity
$42,323
Purchase Details
Closed on
Jul 14, 2021
Sold by
Pettey David and Pettey Mary
Bought by
Wilkinson Danielle
Home Financials for this Owner
Home Financials are based on the most recent Mortgage that was taken out on this home.
Original Mortgage
$291,000
Interest Rate
2.93%
Mortgage Type
New Conventional
Purchase Details
Closed on
Sep 29, 2006
Sold by
Boulders At Rosecrest Development Corp
Bought by
Pettey David and Pettey Mary
Home Financials for this Owner
Home Financials are based on the most recent Mortgage that was taken out on this home.
Original Mortgage
$121,000
Interest Rate
7.12%
Mortgage Type
Unknown
Create a Home Valuation Report for This Property
The Home Valuation Report is an in-depth analysis detailing your home's value as well as a comparison with similar homes in the area
Home Values in the Area
Average Home Value in this Area
Purchase History
| Date | Buyer | Sale Price | Title Company |
|---|---|---|---|
| Nielsen-Bell Landon | -- | Novation Title Insurance Agenc | |
| Wilkinson Danielle | -- | Meridian Title | |
| Pettey David | -- | Meridian Title |
Source: Public Records
Mortgage History
| Date | Status | Borrower | Loan Amount |
|---|---|---|---|
| Open | Nielsen-Bell Landon | $310,500 | |
| Previous Owner | Wilkinson Danielle | $291,000 | |
| Previous Owner | Pettey David | $121,000 |
Source: Public Records
Tax History Compared to Growth
Tax History
| Year | Tax Paid | Tax Assessment Tax Assessment Total Assessment is a certain percentage of the fair market value that is determined by local assessors to be the total taxable value of land and additions on the property. | Land | Improvement |
|---|---|---|---|---|
| 2025 | $2,044 | $349,100 | $122,700 | $226,400 |
| 2024 | $2,044 | $335,200 | $119,400 | $215,800 |
| 2023 | $2,104 | $326,600 | $117,100 | $209,500 |
| 2022 | $2,144 | $331,800 | $114,800 | $217,000 |
| 2021 | $1,751 | $237,900 | $95,400 | $142,500 |
| 2020 | $1,672 | $214,100 | $87,000 | $127,100 |
| 2019 | $1,624 | $204,500 | $68,900 | $135,600 |
| 2018 | $1,485 | $184,100 | $67,000 | $117,100 |
| 2017 | $1,409 | $172,700 | $67,000 | $105,700 |
| 2016 | $1,399 | $164,500 | $67,000 | $97,500 |
| 2015 | $1,395 | $159,000 | $72,500 | $86,500 |
| 2014 | $1,339 | $149,500 | $69,000 | $80,500 |
Source: Public Records
Map
Nearby Homes
- 14481 S Stone Stream St
- 14514 S Windom Rd
- 14347 S Mount Ogden Peak Dr
- 14483 S Ryegate Dr
- 5063 W Arete Way
- 5178 Hedgerose Dr
- 5102 W Valmont Way
- 5198 W Courtly Ln
- 5206 W Windom Rd
- 5098 W Fortrose Dr
- 5194 W Hedgerose Dr
- 5232 W Courtly Ln
- 14649 S Quiet Glen Dr
- 14322 Pepper Grass Ln
- 14254 S Amber Rose Ln
- 14662 S Birken St
- 14642 S Edgemere Dr
- 14478 Sun Bloom Ln
- 14762 S Desert Sage Dr
- 5144 Emmeline Dr
- 5046 W Slate St
- 5046 Slate St
- 5042 W Slate St
- 5042 Slate St
- 5038 Slate St
- 5037 W Boulder Crest Dr
- 5037 W Boulder Dr S
- 5037 W Boulder
- 5053 Slate St
- 5053 W Slate St
- 5057 W Slate St
- 5033 Boulder Crest Dr
- 5033 W Boulder Crest Dr
- 5051 Slate St
- 5033 W Boulder
- 5051 W Slate St
- 5057 Slate St
- 5062 Wind Rock
- 5031 Boulder Crest Dr
- 5047 Slate St