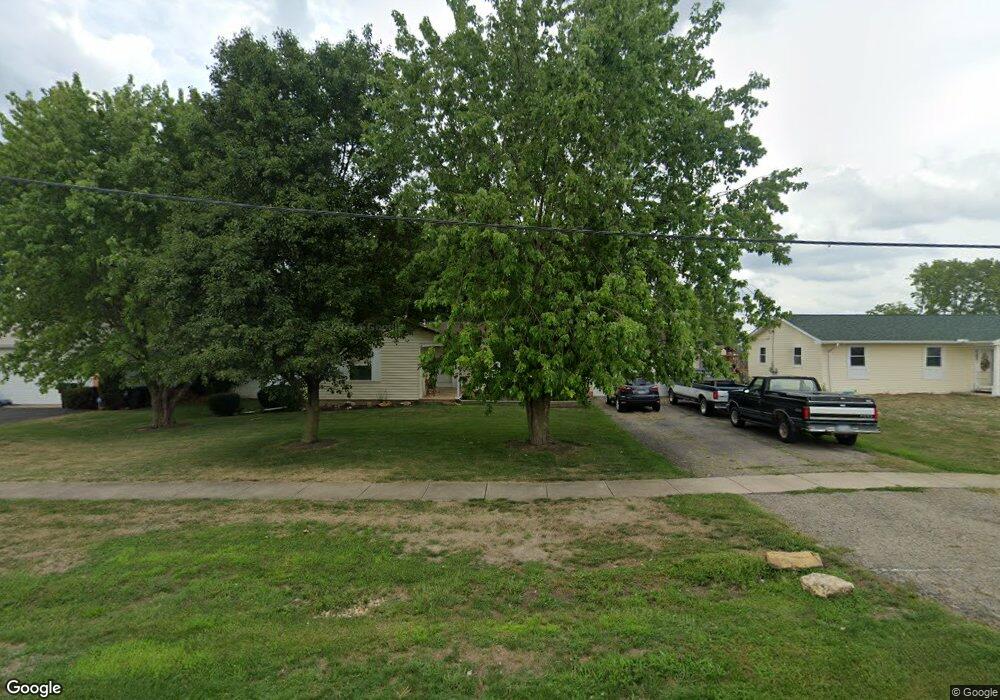
5048 W Main St South Bloomfield, OH 43103
Estimated Value: $237,000 - $288,000
3
Beds
2
Baths
1,272
Sq Ft
$204/Sq Ft
Est. Value
About This Home
This home is located at 5048 W Main St, South Bloomfield, OH 43103 and is currently estimated at $259,384, approximately $203 per square foot. 5048 W Main St is a home located in Pickaway County.
Ownership History
Date
Name
Owned For
Owner Type
Purchase Details
Closed on
Aug 16, 1999
Sold by
Serpette Richard M
Bought by
Canter Carolyn M
Current Estimated Value
Home Financials for this Owner
Home Financials are based on the most recent Mortgage that was taken out on this home.
Original Mortgage
$114,059
Outstanding Balance
$33,084
Interest Rate
7.77%
Mortgage Type
FHA
Estimated Equity
$226,300
Purchase Details
Closed on
Apr 17, 1991
Sold by
Kirk Eva Faye
Bought by
Serpette Richard M
Purchase Details
Closed on
Apr 1, 1991
Create a Home Valuation Report for This Property
The Home Valuation Report is an in-depth analysis detailing your home's value as well as a comparison with similar homes in the area
Home Values in the Area
Average Home Value in this Area
Purchase History
| Date | Buyer | Sale Price | Title Company |
|---|---|---|---|
| Canter Carolyn M | $115,000 | -- | |
| Serpette Richard M | $57,500 | -- | |
| -- | $57,500 | -- |
Source: Public Records
Mortgage History
| Date | Status | Borrower | Loan Amount |
|---|---|---|---|
| Open | Canter Carolyn M | $114,059 |
Source: Public Records
Tax History Compared to Growth
Tax History
| Year | Tax Paid | Tax Assessment Tax Assessment Total Assessment is a certain percentage of the fair market value that is determined by local assessors to be the total taxable value of land and additions on the property. | Land | Improvement |
|---|---|---|---|---|
| 2024 | -- | $58,910 | $10,140 | $48,770 |
| 2023 | $1,907 | $58,910 | $10,140 | $48,770 |
| 2022 | $1,449 | $43,580 | $8,450 | $35,130 |
| 2021 | $1,373 | $43,580 | $8,450 | $35,130 |
| 2020 | $1,376 | $43,580 | $8,450 | $35,130 |
| 2019 | $1,072 | $36,010 | $8,450 | $27,560 |
| 2018 | $1,124 | $36,010 | $8,450 | $27,560 |
| 2017 | $1,954 | $36,010 | $8,450 | $27,560 |
| 2016 | $1,039 | $33,200 | $8,340 | $24,860 |
| 2015 | $1,039 | $33,200 | $8,340 | $24,860 |
| 2014 | $1,040 | $33,200 | $8,340 | $24,860 |
| 2013 | $1,160 | $35,110 | $8,340 | $26,770 |
Source: Public Records
Map
Nearby Homes
- 0 U S 23
- 5050 S Walnut St
- The Daffodil Plan at Riverbend at Scioto Landing
- The Daisy Plan at Riverbend at Scioto Landing
- The Avalon Plan at Riverbend at Scioto Landing
- The Aster Plan at Riverbend at Scioto Landing
- 51 Henderson Ln
- 127 Boutot St
- 14337 Us Highway 23
- 14337 Us Highway 23
- Longwood Plan at Walker Pointe
- Birmingham Plan at Walker Pointe
- Sanibel Plan at Walker Pointe
- Carlisle Plan at Walker Pointe
- Somerset Plan at Walker Pointe
- Chattanooga Plan at Walker Pointe
- Rockford Plan at Walker Pointe
- Hoover Plan at Walker Pointe
- Sedona Plan at Walker Pointe
- Truman Plan at Walker Pointe
- 5046 W Main St
- 5050 W Main St
- 5026 West St
- 5019 N Union St N
- 5019 Union St
- 5031 W Main St
- 5044 W Main St
- 5038 West St
- 5049 W Main St
- 5013 S Union St S
- 5016 N Union St N
- 5023 W Main St
- 3001 Union St
- 5051 W Main St
- 5016 W Main St
- 5022 N Union St N
- 5027 West St
- 5033 West St
- 5022 W North St
- 5023 West St