5049 W Jupiter Way Chandler, AZ 85226
West Chandler NeighborhoodEstimated Value: $367,619 - $442,000
--
Bed
3
Baths
1,378
Sq Ft
$304/Sq Ft
Est. Value
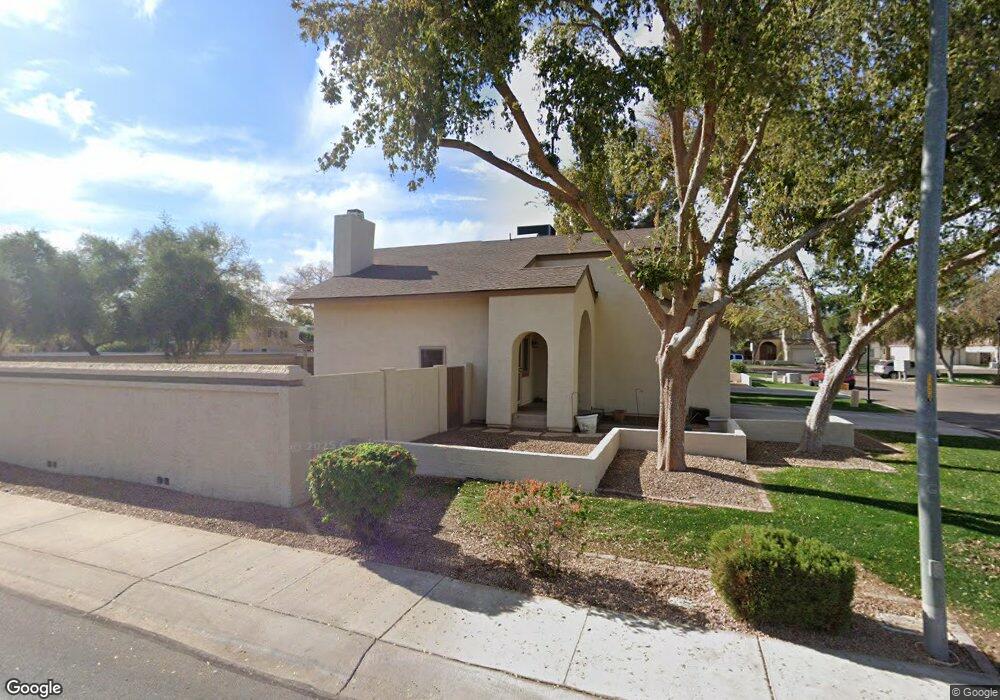
About This Home
This home is located at 5049 W Jupiter Way, Chandler, AZ 85226 and is currently estimated at $418,655, approximately $303 per square foot. 5049 W Jupiter Way is a home located in Maricopa County with nearby schools including Kyrene de la Paloma School, Kyrene del Pueblo Middle School, and Corona Del Sol High School.
Ownership History
Date
Name
Owned For
Owner Type
Purchase Details
Closed on
Jul 1, 2016
Sold by
Langenfeld Amy K
Bought by
Langenfeld Amy K and Langenfeld Living Trust
Current Estimated Value
Purchase Details
Closed on
Mar 2, 1999
Sold by
Hart Cathlyn Marie
Bought by
Langenfeld Amy K
Home Financials for this Owner
Home Financials are based on the most recent Mortgage that was taken out on this home.
Original Mortgage
$95,900
Outstanding Balance
$23,111
Interest Rate
6.7%
Mortgage Type
New Conventional
Estimated Equity
$395,544
Purchase Details
Closed on
Oct 31, 1997
Sold by
Quijas Raymond
Bought by
Prudential Residential Svcs Ltd Prtnrshp
Purchase Details
Closed on
Oct 27, 1997
Sold by
Hart William D
Bought by
Hart Cathlyn Marie
Create a Home Valuation Report for This Property
The Home Valuation Report is an in-depth analysis detailing your home's value as well as a comparison with similar homes in the area
Home Values in the Area
Average Home Value in this Area
Purchase History
| Date | Buyer | Sale Price | Title Company |
|---|---|---|---|
| Langenfeld Amy K | -- | None Available | |
| Langenfeld Amy K | $119,900 | Security Title Agency | |
| Prudential Residential Svcs Ltd Prtnrshp | -- | Transnation Title Ins Co | |
| Hart Cathlyn Marie | -- | Transnation Title Ins Co | |
| Hart Cathlyn Marie | $108,900 | Transnation Title Ins Co |
Source: Public Records
Mortgage History
| Date | Status | Borrower | Loan Amount |
|---|---|---|---|
| Open | Langenfeld Amy K | $95,900 |
Source: Public Records
Tax History Compared to Growth
Tax History
| Year | Tax Paid | Tax Assessment Tax Assessment Total Assessment is a certain percentage of the fair market value that is determined by local assessors to be the total taxable value of land and additions on the property. | Land | Improvement |
|---|---|---|---|---|
| 2025 | $1,442 | $18,099 | -- | -- |
| 2024 | $1,379 | $17,237 | -- | -- |
| 2023 | $1,379 | $33,030 | $6,600 | $26,430 |
| 2022 | $1,312 | $24,370 | $4,870 | $19,500 |
| 2021 | $1,384 | $23,210 | $4,640 | $18,570 |
| 2020 | $1,353 | $20,780 | $4,150 | $16,630 |
| 2019 | $1,313 | $18,900 | $3,780 | $15,120 |
| 2018 | $1,270 | $17,370 | $3,470 | $13,900 |
| 2017 | $1,210 | $16,230 | $3,240 | $12,990 |
| 2016 | $1,235 | $14,960 | $2,990 | $11,970 |
| 2015 | $1,140 | $14,160 | $2,830 | $11,330 |
Source: Public Records
Map
Nearby Homes
- 5137 W Jupiter Way
- 5143 W Mercury Way
- 5043 W Whitten St
- 4624 W Chicago St
- 5151 W Glenview Place
- 4613 W Chicago St Unit 2
- 4628 W Buffalo St
- 5361 W Saragosa St
- 5455 W Buffalo St
- 5041 W Kesler Ln
- 4790 W Geronimo St
- 5330 W Kesler Ln
- 295 N Rural Rd Unit 160
- 295 N Rural Rd Unit 128
- 295 N Rural Rd Unit 202
- 4650 W Geronimo St
- 840 S Pineview Dr
- 5580 W Kesler St
- 4554 W Detroit St
- 5882 W Mercury Way
- 5053 W Jupiter Way
- 5057 W Jupiter Way
- 5042 W Jupiter Way
- 5061 W Jupiter Way
- 5046 W Jupiter Way
- 202 S Del Pueblo St
- 5008 W Chicago Cir N
- 5008 W Chicago Cir N Unit N
- 5065 W Jupiter Way
- 206 S Del Pueblo St
- 5069 W Jupiter Way
- 5073 W Jupiter Way
- 5006 W Chicago Cir N
- 5050 W Jupiter Way
- 5077 W Jupiter Way
- 5054 W Jupiter Way
- 210 S Del Pueblo St
- 5078 W Jupiter Way
- 5058 W Jupiter Way
- 5004 W Chicago Cir N