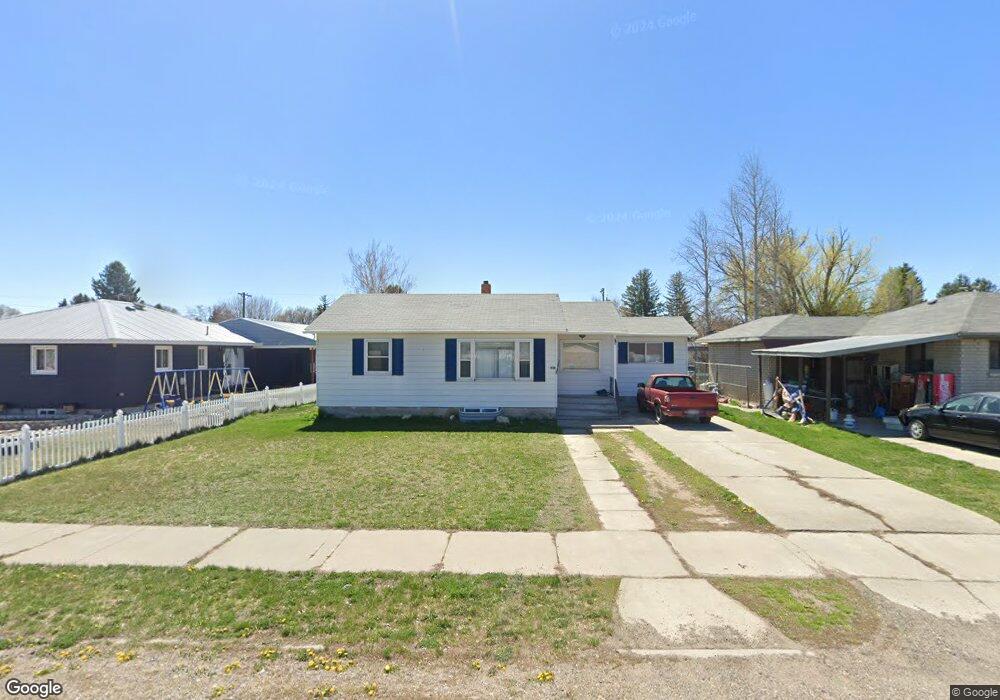
505 15th St Rupert, ID 83350
Estimated Value: $259,000 - $349,000
3
Beds
1
Bath
1,628
Sq Ft
$176/Sq Ft
Est. Value
About This Home
This home is located at 505 15th St, Rupert, ID 83350 and is currently estimated at $285,893, approximately $175 per square foot. 505 15th St is a home located in Minidoka County with nearby schools including Rupert Elementary School, Minico Senior High School, and Artec Charter School.
Ownership History
Date
Name
Owned For
Owner Type
Purchase Details
Closed on
Feb 5, 2010
Sold by
Carrillo Jose N and Carrillo Margarita
Bought by
Carrillo Jose N and Carrillo Margarita
Current Estimated Value
Purchase Details
Closed on
Oct 22, 2009
Sold by
Tipton Corey M
Bought by
Carillo Jose N and Carillo Margarita
Home Financials for this Owner
Home Financials are based on the most recent Mortgage that was taken out on this home.
Original Mortgage
$90,372
Outstanding Balance
$58,831
Interest Rate
5.02%
Mortgage Type
New Conventional
Estimated Equity
$227,062
Purchase Details
Closed on
Dec 6, 2006
Sold by
Dockstader H Jim H and Dockstader Jennifer V
Bought by
Tipton Corey M
Home Financials for this Owner
Home Financials are based on the most recent Mortgage that was taken out on this home.
Original Mortgage
$84,694
Interest Rate
6.21%
Mortgage Type
New Conventional
Create a Home Valuation Report for This Property
The Home Valuation Report is an in-depth analysis detailing your home's value as well as a comparison with similar homes in the area
Home Values in the Area
Average Home Value in this Area
Purchase History
| Date | Buyer | Sale Price | Title Company |
|---|---|---|---|
| Carrillo Jose N | -- | -- | |
| Carillo Jose N | -- | -- | |
| Tipton Corey M | -- | -- | |
| Tipton Corey M | -- | -- |
Source: Public Records
Mortgage History
| Date | Status | Borrower | Loan Amount |
|---|---|---|---|
| Open | Carillo Jose N | $90,372 | |
| Previous Owner | Tipton Corey M | $84,694 |
Source: Public Records
Tax History
| Year | Tax Paid | Tax Assessment Tax Assessment Total Assessment is a certain percentage of the fair market value that is determined by local assessors to be the total taxable value of land and additions on the property. | Land | Improvement |
|---|---|---|---|---|
| 2025 | $960 | $230,332 | $40,132 | $190,200 |
| 2024 | $1,003 | $230,332 | $40,132 | $190,200 |
| 2023 | $837 | $219,612 | $40,132 | $179,480 |
| 2022 | $1,033 | $191,036 | $36,516 | $154,520 |
| 2021 | $951 | $141,482 | $22,712 | $118,770 |
| 2020 | $861 | $121,223 | $16,783 | $104,440 |
| 2019 | $842 | $109,973 | $0 | $0 |
| 2018 | $812 | $98,733 | $16,783 | $81,950 |
| 2017 | $729 | $97,604 | $10,034 | $87,570 |
| 2016 | $664 | $41,858 | $0 | $0 |
| 2015 | $608 | $0 | $0 | $0 |
| 2014 | $608 | $0 | $0 | $0 |
| 2012 | -- | $0 | $0 | $0 |
Source: Public Records
Map
Nearby Homes
Your Personal Tour Guide
Ask me questions while you tour the home.