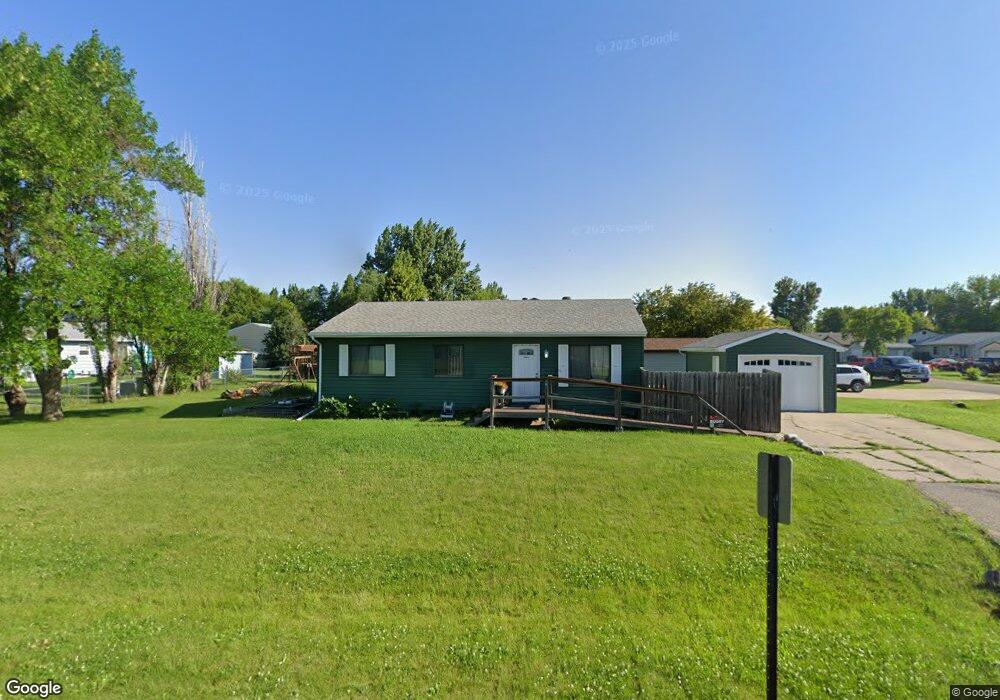
505 3rd St Mapleton, ND 58059
Estimated Value: $209,000 - $277,000
3
Beds
1
Bath
912
Sq Ft
$258/Sq Ft
Est. Value
About This Home
This home is located at 505 3rd St, Mapleton, ND 58059 and is currently estimated at $235,175, approximately $257 per square foot. 505 3rd St is a home located in Cass County with nearby schools including Mapleton Elementary School.
Ownership History
Date
Name
Owned For
Owner Type
Purchase Details
Closed on
Nov 22, 2013
Sold by
Rebuilding Together Fargo Moorhead Area
Bought by
Pfau Nicholas
Current Estimated Value
Home Financials for this Owner
Home Financials are based on the most recent Mortgage that was taken out on this home.
Original Mortgage
$125,681
Outstanding Balance
$91,913
Interest Rate
3.75%
Mortgage Type
FHA
Estimated Equity
$143,262
Purchase Details
Closed on
Dec 21, 2012
Sold by
Kluth Shane and Kluth Kristina
Bought by
Chase Home Finance Llc
Purchase Details
Closed on
Oct 17, 2012
Sold by
Kluth Shane and Kluth Kristina
Bought by
Chase Home Finance Llc
Purchase Details
Closed on
May 15, 2006
Sold by
Kluth Shane and Kluth Kristina
Bought by
Kluth Shane and Kluth Kristina
Home Financials for this Owner
Home Financials are based on the most recent Mortgage that was taken out on this home.
Original Mortgage
$108,000
Interest Rate
6.56%
Mortgage Type
Adjustable Rate Mortgage/ARM
Create a Home Valuation Report for This Property
The Home Valuation Report is an in-depth analysis detailing your home's value as well as a comparison with similar homes in the area
Purchase History
| Date | Buyer | Sale Price | Title Company |
|---|---|---|---|
| Pfau Nicholas | $128,000 | Title Co | |
| Chase Home Finance Llc | $76,492 | None Available | |
| Chase Home Finance Llc | -- | None Available | |
| Kluth Shane | -- | -- |
Source: Public Records
Mortgage History
| Date | Status | Borrower | Loan Amount |
|---|---|---|---|
| Open | Pfau Nicholas | $125,681 | |
| Previous Owner | Kluth Shane | $108,000 |
Source: Public Records
Tax History
| Year | Tax Paid | Tax Assessment Tax Assessment Total Assessment is a certain percentage of the fair market value that is determined by local assessors to be the total taxable value of land and additions on the property. | Land | Improvement |
|---|---|---|---|---|
| 2024 | $2,987 | $94,800 | $15,100 | $79,700 |
| 2023 | $2,875 | $92,300 | $15,100 | $77,200 |
| 2022 | $2,510 | $84,750 | $15,100 | $69,650 |
| 2021 | $2,372 | $76,700 | $11,650 | $65,050 |
| 2020 | $2,254 | $73,850 | $11,650 | $62,200 |
| 2019 | $2,258 | $73,850 | $11,650 | $62,200 |
| 2018 | $2,267 | $73,200 | $11,650 | $61,550 |
| 2017 | $2,119 | $71,900 | $11,650 | $60,250 |
| 2016 | $1,464 | $70,750 | $7,150 | $63,600 |
| 2015 | $1,296 | $65,500 | $6,600 | $58,900 |
| 2014 | $1,266 | $59,550 | $6,000 | $53,550 |
| 2013 | $1,339 | $57,050 | $6,000 | $51,050 |
Source: Public Records
Map
Nearby Homes
Your Personal Tour Guide
Ask me questions while you tour the home.