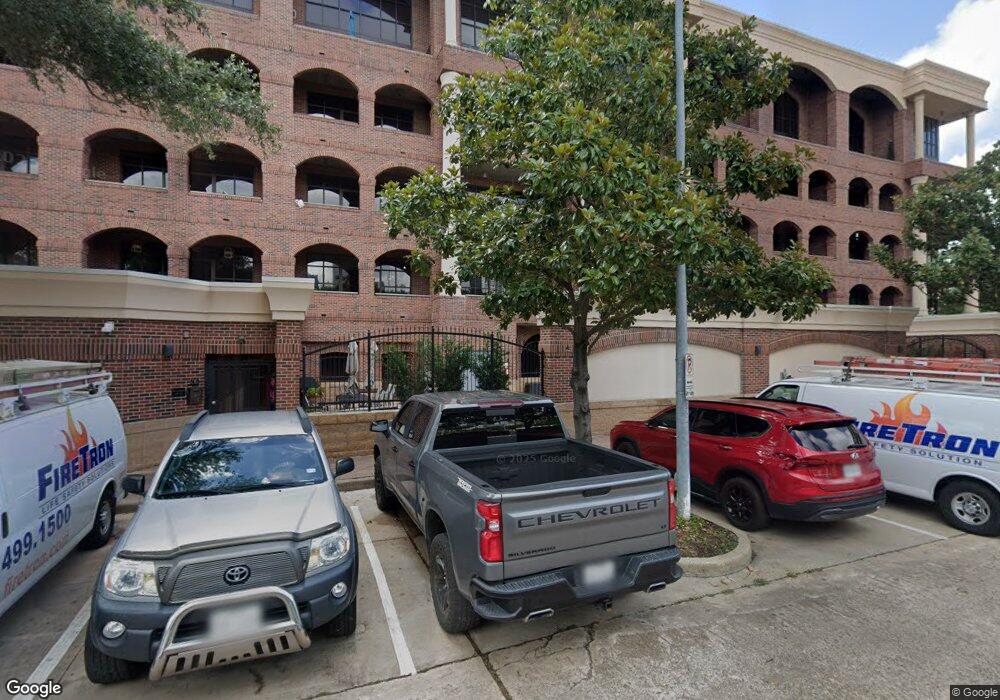
505 Bastrop St Unit 210 Houston, TX 77003
East Downtown NeighborhoodEstimated Value: $347,000 - $380,000
2
Beds
1
Bath
1,339
Sq Ft
$269/Sq Ft
Est. Value
About This Home
This home is located at 505 Bastrop St Unit 210, Houston, TX 77003 and is currently estimated at $359,744, approximately $268 per square foot. 505 Bastrop St Unit 210 is a home located in Harris County with nearby schools including Burnet Elementary School, Yolanda Black Navarro Middle School, and Wheatley High School.
Ownership History
Date
Name
Owned For
Owner Type
Purchase Details
Closed on
Feb 10, 2017
Sold by
Ful Krum Technical Resources Inc
Bought by
Greene Joanne
Current Estimated Value
Home Financials for this Owner
Home Financials are based on the most recent Mortgage that was taken out on this home.
Original Mortgage
$194,000
Outstanding Balance
$160,778
Interest Rate
4.32%
Mortgage Type
New Conventional
Estimated Equity
$198,966
Purchase Details
Closed on
Aug 19, 2014
Sold by
Donny Hershel
Bought by
Elbar Investments Inc
Purchase Details
Closed on
Aug 5, 2014
Sold by
Elbar Investments Inc
Bought by
Fulkrum Technical Resources Inc
Purchase Details
Closed on
Apr 4, 2003
Sold by
Stanford Development Corp
Bought by
Donny Hershel
Home Financials for this Owner
Home Financials are based on the most recent Mortgage that was taken out on this home.
Original Mortgage
$219,200
Interest Rate
5%
Mortgage Type
Purchase Money Mortgage
Create a Home Valuation Report for This Property
The Home Valuation Report is an in-depth analysis detailing your home's value as well as a comparison with similar homes in the area
Home Values in the Area
Average Home Value in this Area
Purchase History
| Date | Buyer | Sale Price | Title Company |
|---|---|---|---|
| Greene Joanne | -- | None Available | |
| Elbar Investments Inc | -- | -- | |
| Elbar Investments Inc | -- | -- | |
| Fulkrum Technical Resources Inc | -- | None Available | |
| Donny Hershel | -- | Stewart Title Company |
Source: Public Records
Mortgage History
| Date | Status | Borrower | Loan Amount |
|---|---|---|---|
| Open | Greene Joanne | $194,000 | |
| Previous Owner | Donny Hershel | $219,200 |
Source: Public Records
Tax History Compared to Growth
Tax History
| Year | Tax Paid | Tax Assessment Tax Assessment Total Assessment is a certain percentage of the fair market value that is determined by local assessors to be the total taxable value of land and additions on the property. | Land | Improvement |
|---|---|---|---|---|
| 2025 | $4,969 | $335,246 | $64,431 | $270,815 |
| 2024 | $4,969 | $348,156 | $66,150 | $282,006 |
| 2023 | $4,969 | $348,156 | $66,150 | $282,006 |
| 2022 | $7,329 | $324,276 | $61,612 | $262,664 |
| 2021 | $7,032 | $286,354 | $54,407 | $231,947 |
| 2020 | $7,741 | $303,961 | $57,753 | $246,208 |
| 2019 | $8,072 | $303,961 | $57,753 | $246,208 |
| 2018 | $7,692 | $303,961 | $57,753 | $246,208 |
| 2017 | $7,062 | $279,273 | $53,062 | $226,211 |
| 2016 | $6,945 | $274,657 | $52,185 | $222,472 |
| 2015 | $4,118 | $274,657 | $52,185 | $222,472 |
| 2014 | $4,118 | $222,816 | $42,335 | $180,481 |
Source: Public Records
Map
Nearby Homes
- 2513 Garrow St
- 2205 Mckinney St Unit 510
- 2205 Mckinney St Unit 412
- 3 N Saint Charles St Unit A
- 3 N Saint Charles St Unit F
- 709 Delano St
- 1027 Saint Charles St
- 2843 Rusk St
- 704 Paige St
- 3 N St Charles St F St
- 2901 Preston St
- 2414 Canal St
- 2414 Canal St Unit A
- 2414 Canal St Unit D
- 2414 Canal St Unit F
- 808 Paige St
- 2412 Canal St Unit K
- 315 Middleton St
- 2503 Dallas St
- 2909 Sherman St
- 505 Bastrop St Unit 505
- 505 Bastrop St Unit 205
- 505 Bastrop St Unit 410
- 505 Bastrop St Unit 504
- 505 Bastrop St Unit 302
- 505 Bastrop St Unit 306
- 505 Bastrop St Unit 204
- 505 Bastrop St Unit 403
- 505 Bastrop St Unit 310
- 505 Bastrop St Unit 203
- 505 Bastrop St Unit 209
- 505 Bastrop St Unit 309
- 505 Bastrop St Unit 406
- 505 Bastrop St Unit 401
- 505 Bastrop St Unit 409
- 505 Bastrop St Unit 303
- 505 Bastrop St Unit 201
- 505 Bastrop St Unit 208
- 505 Bastrop St Unit 510
- 505 Bastrop St Unit 509