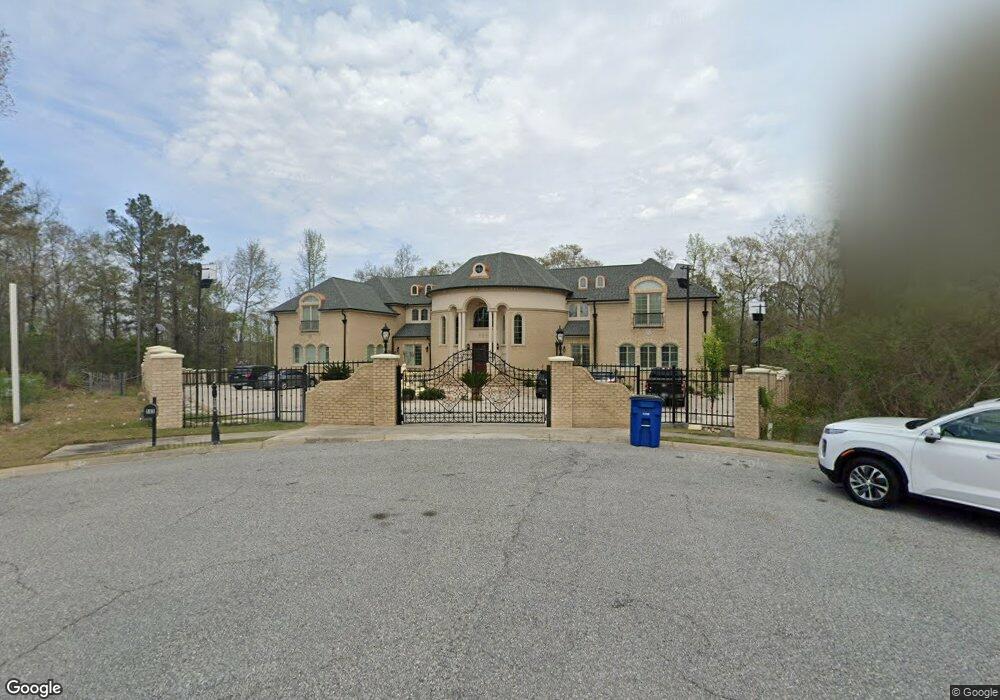
505 Bellerive Ct Macon, GA 31216
Estimated Value: $884,000 - $1,932,000
6
Beds
8
Baths
8,129
Sq Ft
$170/Sq Ft
Est. Value
About This Home
This home is located at 505 Bellerive Ct, Macon, GA 31216 and is currently estimated at $1,383,398, approximately $170 per square foot. 505 Bellerive Ct is a home located in Bibb County with nearby schools including Porter Elementary School, Rutland Middle School, and Rutland High School.
Ownership History
Date
Name
Owned For
Owner Type
Purchase Details
Closed on
Jan 1, 2026
Sold by
Rhody Development Llc and Rhody Development Macon-Bellerive Ct Llc
Bought by
Rhody Development Macon-Bellerive Ct Llc
Current Estimated Value
Purchase Details
Closed on
Jul 19, 2017
Sold by
Patel Mukesh B
Bought by
Rhody Development Llc
Purchase Details
Closed on
Oct 24, 2012
Sold by
Kunj Construction Usa Ina
Bought by
Patel Mukesh B
Home Financials for this Owner
Home Financials are based on the most recent Mortgage that was taken out on this home.
Original Mortgage
$635,499
Interest Rate
3.53%
Mortgage Type
Unknown
Purchase Details
Closed on
Oct 26, 2011
Sold by
Patel Pankaj
Bought by
Kunj Construction Usa Inc
Purchase Details
Closed on
Jan 31, 2011
Sold by
Pride Investments Llc
Bought by
Patel Pankaj
Purchase Details
Closed on
May 14, 2010
Sold by
Cb&T Bank Of Middle Ga
Bought by
Pride Investments Llc
Purchase Details
Closed on
Jul 15, 2009
Sold by
Flint River Mortgage Invmts
Bought by
Cb&T Bank Of Middle Ga
Create a Home Valuation Report for This Property
The Home Valuation Report is an in-depth analysis detailing your home's value as well as a comparison with similar homes in the area
Purchase History
| Date | Buyer | Sale Price | Title Company |
|---|---|---|---|
| Rhody Development Macon-Bellerive Ct Llc | -- | None Listed On Document | |
| Rhody Development Llc | -- | None Available | |
| Patel Mukesh B | -- | None Available | |
| Kunj Construction Usa Inc | -- | None Available | |
| Patel Pankaj | $39,500 | None Available | |
| Pride Investments Llc | $287,500 | -- | |
| Cb&T Bank Of Middle Ga | -- | -- |
Source: Public Records
Mortgage History
| Date | Status | Borrower | Loan Amount |
|---|---|---|---|
| Previous Owner | Patel Mukesh B | $635,499 |
Source: Public Records
Tax History
| Year | Tax Paid | Tax Assessment Tax Assessment Total Assessment is a certain percentage of the fair market value that is determined by local assessors to be the total taxable value of land and additions on the property. | Land | Improvement |
|---|---|---|---|---|
| 2025 | $16,058 | $653,445 | $14,000 | $639,445 |
| 2024 | $15,049 | $592,546 | $14,000 | $578,546 |
| 2023 | $15,049 | $592,546 | $14,000 | $578,546 |
| 2022 | $18,232 | $526,624 | $14,000 | $512,624 |
| 2021 | $16,374 | $430,901 | $12,600 | $418,301 |
| 2020 | $16,729 | $430,901 | $12,600 | $418,301 |
| 2019 | $14,763 | $377,133 | $12,600 | $364,533 |
| 2018 | $22,789 | $377,133 | $12,600 | $364,533 |
| 2017 | $14,130 | $377,133 | $12,600 | $364,533 |
| 2016 | $13,096 | $378,533 | $14,000 | $364,533 |
| 2015 | $18,537 | $378,533 | $14,000 | $364,533 |
| 2014 | $18,316 | $373,440 | $14,000 | $359,440 |
Source: Public Records
Map
Nearby Homes
- 428 Bellerive Trace
- 171 Mcclain Cir
- 130 Mcclain Cir
- 426 Southern Oaks Dr
- 5514 Bankston Lake Rd
- 5524 Bankston Lake Rd
- 444 Southern Oaks Dr
- 448 Southern Oaks Dr Unit LOT 30
- 450 Southern Oaks Dr
- 219 Trenton Terrace
- 452 Southern Oaks Dr
- 363 Eagle Ridge Rd
- 456 Southern Oaks Dr
- 456 Southern Oaks Dr Unit 33
- 5250 Tinker Dr
- 458 Southern Oaks Dr
- 463 Southern Oaks Dr Unit LOT 35B
- 620 Britton Way
- 109 Oakview Club Dr
- 3636 Bonanza Dr
- 504 Bellerive Ct Unit 142
- 504 Bellerive Ct
- 411 Bellerive Trace Unit 142
- 411 Bellerive Trace
- 415 Bellerive Trace Unit 142
- 415 Bellerive Trace
- 419 Bellerive Trace
- 413 Bellerive Trace
- 409 Bellerive Trace Unit 19
- 409 Bellerive Trace
- 160 Mcclain Cir
- 421 Bellerive Trace
- 158 Mcclain Cir
- 410 Bellerive Trace
- 412 Bellerive Trace
- 405 Bellerive Trace
- 420 Bellerive Trace Unit 141
- 420 Bellerive Trace
- 423 Bellerive Trace
- 416 Bellerive Trace Unit 141
Your Personal Tour Guide
Ask me questions while you tour the home.