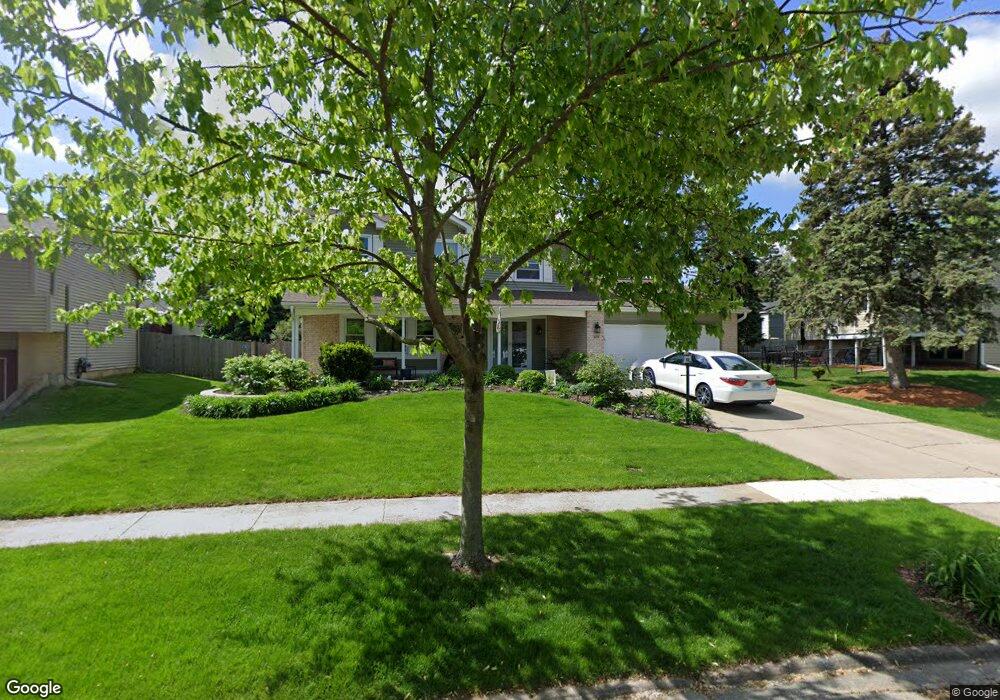
505 Castle Ct Unit 5 Bolingbrook, IL 60440
East Bolingbrook NeighborhoodEstimated Value: $376,926 - $427,000
--
Bed
1
Bath
2,181
Sq Ft
$188/Sq Ft
Est. Value
About This Home
This home is located at 505 Castle Ct Unit 5, Bolingbrook, IL 60440 and is currently estimated at $410,982, approximately $188 per square foot. 505 Castle Ct Unit 5 is a home located in Will County with nearby schools including Jonas E Salk Elementary School, Hubert H Humphrey Middle School, and Bolingbrook High School.
Ownership History
Date
Name
Owned For
Owner Type
Purchase Details
Closed on
May 8, 2019
Sold by
Guise William E and Guise Julianne S
Bought by
Guise William E and Guise Julianne S
Current Estimated Value
Purchase Details
Closed on
Oct 27, 1995
Sold by
Detten William T and Detten Yvonne M
Bought by
Guise William E and Guise Julianne S
Home Financials for this Owner
Home Financials are based on the most recent Mortgage that was taken out on this home.
Original Mortgage
$144,600
Outstanding Balance
$2,025
Interest Rate
7.61%
Estimated Equity
$408,957
Create a Home Valuation Report for This Property
The Home Valuation Report is an in-depth analysis detailing your home's value as well as a comparison with similar homes in the area
Home Values in the Area
Average Home Value in this Area
Purchase History
| Date | Buyer | Sale Price | Title Company |
|---|---|---|---|
| Guise William E | -- | Attorney | |
| Guise William E | $161,000 | -- |
Source: Public Records
Mortgage History
| Date | Status | Borrower | Loan Amount |
|---|---|---|---|
| Open | Guise William E | $144,600 |
Source: Public Records
Tax History Compared to Growth
Tax History
| Year | Tax Paid | Tax Assessment Tax Assessment Total Assessment is a certain percentage of the fair market value that is determined by local assessors to be the total taxable value of land and additions on the property. | Land | Improvement |
|---|---|---|---|---|
| 2024 | $9,836 | $122,499 | $20,174 | $102,325 |
| 2023 | $9,836 | $110,221 | $18,152 | $92,069 |
| 2022 | $8,715 | $99,170 | $16,365 | $82,805 |
| 2021 | $8,228 | $92,726 | $15,302 | $77,424 |
| 2020 | $8,464 | $89,677 | $14,799 | $74,878 |
| 2019 | $8,193 | $85,406 | $14,094 | $71,312 |
| 2018 | $7,538 | $78,577 | $12,967 | $65,610 |
| 2017 | $7,178 | $74,481 | $12,291 | $62,190 |
| 2016 | $6,970 | $70,900 | $11,700 | $59,200 |
| 2015 | $5,816 | $66,000 | $10,900 | $55,100 |
| 2014 | $5,816 | $60,000 | $9,900 | $50,100 |
| 2013 | $5,816 | $60,000 | $9,900 | $50,100 |
Source: Public Records
Map
Nearby Homes
- 304 N Pinecrest Rd
- 355 Falconridge Way
- 338 Stafford Way
- 157 Vernon Dr Unit 6
- 520 White Oak Rd
- 220 N Ashbury Ave
- 144 N Pinecrest Rd
- 101 Seabury Rd
- 325 Rockhurst Rd
- 564 White Oak Rd
- 451 Alcester Ct
- 316 Bedford Rd
- 312 Homestead Dr
- 308 Pacific Dr
- 129 Oxford Rd Unit 5
- 308 Homewood Dr
- 168 Bedford Rd
- 220 Falcon Ridge Way
- 219 Monterey Dr
- 113 Cedarwood Ave
- 509 Castle Ct
- 308 N Pinecrest Rd
- 506 Rockhurst Rd
- 510 Rockhurst Rd
- 513 Castle Ct
- 502 Rockhurst Rd
- 316 N Pinecrest Rd
- 514 Rockhurst Rd
- 510 Castle Ct
- 517 Castle Ct
- 518 Rockhurst Rd
- 478 Galahad Rd Unit 5
- 514 Castle Ct
- 317 N Pinecrest Rd
- 477 Galahad Rd
- 321 N Pinecrest Rd
- 521 Castle Ct
- 320 N Pinecrest Rd
- 518 Castle Ct
- 484 Rockhurst Rd