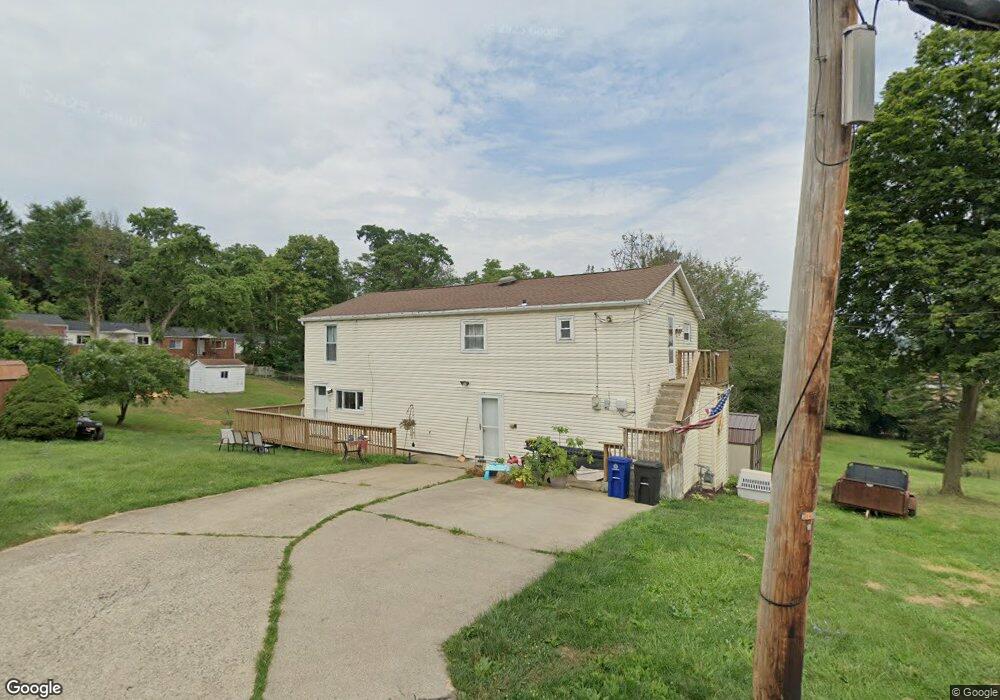
505 Cecil St Canonsburg, PA 15317
Estimated Value: $119,000 - $149,087
2
Beds
1
Bath
987
Sq Ft
$136/Sq Ft
Est. Value
About This Home
This home is located at 505 Cecil St, Canonsburg, PA 15317 and is currently estimated at $133,772, approximately $135 per square foot. 505 Cecil St is a home located in Washington County with nearby schools including Canon-Mcmillan Senior High School and Central Christian Academy.
Ownership History
Date
Name
Owned For
Owner Type
Purchase Details
Closed on
Sep 27, 2019
Sold by
Spilak Melissa G
Bought by
Tabler Amy Beth and Tabler Kimberly Lee
Current Estimated Value
Home Financials for this Owner
Home Financials are based on the most recent Mortgage that was taken out on this home.
Original Mortgage
$47,000
Outstanding Balance
$41,174
Interest Rate
3.5%
Mortgage Type
New Conventional
Estimated Equity
$92,598
Purchase Details
Closed on
Feb 27, 2018
Sold by
Noble Joseph J
Bought by
Spilak Melissa G
Home Financials for this Owner
Home Financials are based on the most recent Mortgage that was taken out on this home.
Original Mortgage
$88,282
Interest Rate
4.04%
Mortgage Type
New Conventional
Purchase Details
Closed on
Nov 22, 2016
Sold by
Lombardo John A and Lombardo Deborah J
Bought by
Noble Joseph J
Purchase Details
Closed on
Jan 9, 2014
Sold by
Altieri William
Bought by
Lombardo John A
Create a Home Valuation Report for This Property
The Home Valuation Report is an in-depth analysis detailing your home's value as well as a comparison with similar homes in the area
Home Values in the Area
Average Home Value in this Area
Purchase History
| Date | Buyer | Sale Price | Title Company |
|---|---|---|---|
| Tabler Amy Beth | $97,000 | None Available | |
| Spilak Melissa G | $87,400 | None Available | |
| Noble Joseph J | $51,000 | None Available | |
| Lombardo John A | -- | -- |
Source: Public Records
Mortgage History
| Date | Status | Borrower | Loan Amount |
|---|---|---|---|
| Open | Tabler Amy Beth | $47,000 | |
| Previous Owner | Spilak Melissa G | $88,282 |
Source: Public Records
Tax History Compared to Growth
Tax History
| Year | Tax Paid | Tax Assessment Tax Assessment Total Assessment is a certain percentage of the fair market value that is determined by local assessors to be the total taxable value of land and additions on the property. | Land | Improvement |
|---|---|---|---|---|
| 2025 | $1,174 | $67,200 | $26,800 | $40,400 |
| 2024 | $1,140 | $67,200 | $26,800 | $40,400 |
| 2023 | $1,140 | $67,200 | $26,800 | $40,400 |
| 2022 | $1,140 | $67,200 | $26,800 | $40,400 |
| 2021 | $1,108 | $67,200 | $26,800 | $40,400 |
| 2020 | $1,080 | $67,200 | $26,800 | $40,400 |
| 2019 | $1,060 | $67,200 | $26,800 | $40,400 |
| 2018 | $1,027 | $67,200 | $26,800 | $40,400 |
| 2017 | $805 | $67,200 | $26,800 | $40,400 |
| 2016 | $585 | $4,315 | $1,088 | $3,227 |
| 2015 | $585 | $4,315 | $1,088 | $3,227 |
| 2014 | $107 | $4,315 | $1,088 | $3,227 |
| 2013 | $107 | $4,315 | $1,088 | $3,227 |
Source: Public Records
Map
Nearby Homes
- 407 Greenside Ave
- 126 Vine St
- 137 Vine St
- 146 Smithfield St
- 142 Vine St
- Lot 69 Smithfield St
- 215 Smithfield St
- 157 E College St
- 146 E College St
- 218 E Pitt St
- 31 W College St
- 556 Tannehill St
- 337 N Jefferson Ave
- 504 Tannehill St
- 129 N Jefferson Ave
- 16 Chestnut St
- 126 Church Way
- 255 Vine St
- 523 Craighead St
- #11 Craighead St
- 505 Cecil St
- 505 Cecil St
- 45 E Pitt St
- 502 Cecil St
- 109 E Pitt St
- 37 E Pitt St
- 420 Greenside Ave
- 416 Greenside Ave
- 42 E Pitt St
- 117 E Pitt St
- 416 1/2 Greenside Ave
- 413 Greenside Ave
- 414 Greenside Ave
- 114 E Pitt St
- 116 E Pitt St
- 412 Greenside Ave
- 30 E Pitt St
- 26 E Pitt St
- 26 1/2 E Pitt St
- 25 E Pitt St