Hillmount 505 Cherry St SE Grand Rapids, MI 49503
Heritage Hill NeighborhoodEstimated Value: $139,000 - $159,960
About This Home
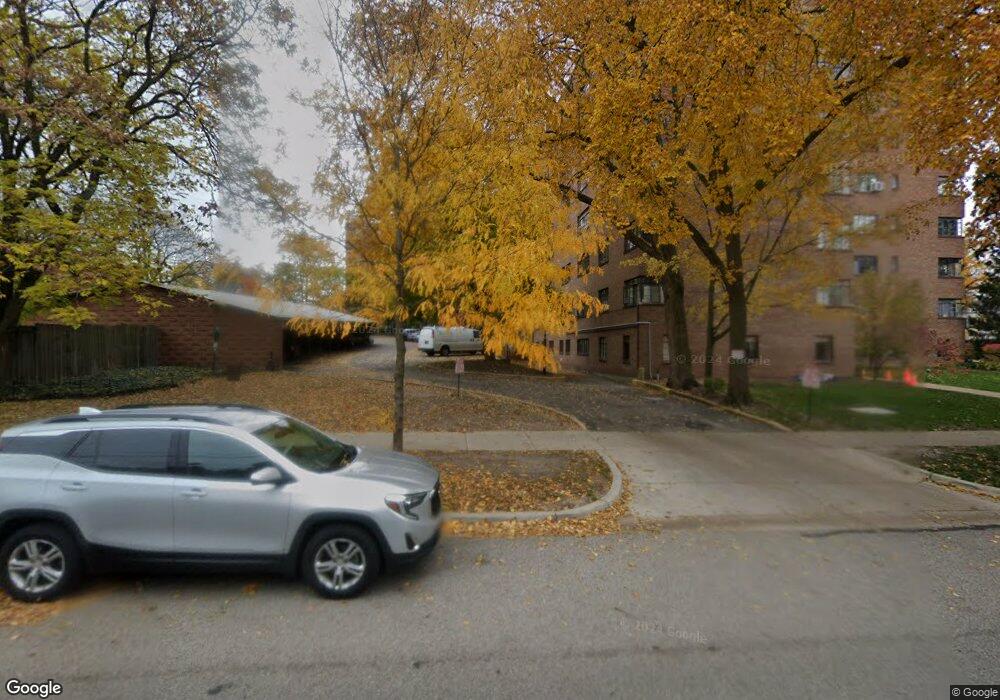
This home is located at 505 Cherry St SE, Grand Rapids, MI 49503 and is currently estimated at $146,990, approximately $398 per square foot. 505 Cherry St SE is a home located in Kent County with nearby schools including Grand Rapids Montessori Academy, Alger Middle School, and Ottawa Hills High School.
Ownership History
We collect this data history from publicly available records. To have your information removed, we recommend requesting removal directly through your county’s website.
Purchase Details
Home Financials for this Owner
Home Financials are based on the most recent Mortgage that was taken out on this home.Purchase Details
Home Financials for this Owner
Home Financials are based on the most recent Mortgage that was taken out on this home.Purchase Details
Purchase Details
Purchase Details
Home Financials for this Owner
Home Financials are based on the most recent Mortgage that was taken out on this home.Purchase Details
Home Financials for this Owner
Home Financials are based on the most recent Mortgage that was taken out on this home.Purchase Details
Home Financials for this Owner
Home Financials are based on the most recent Mortgage that was taken out on this home.Home Values in the Area
Average Home Value in this Area
Purchase History
We collect this data history from publicly available records. To have your information removed, we recommend requesting removal directly through your county’s website.
| Date | Buyer | Sale Price | Title Company |
|---|---|---|---|
| $145,000 | Irongate Title Agency | ||
| $120,200 | Grand Rapids Title | ||
| $120,200 | Grand Rapids Title | ||
| $106,000 | Grand Rapids Title Co Llc | ||
| $80,500 | Title Resource Agency | ||
| $67,000 | Examiners Title | ||
| -- | None Available |
Mortgage History
We collect this data history from publicly available records. To have your information removed, we recommend requesting removal directly through your county’s website.
| Date | Status | Borrower | Loan Amount |
|---|---|---|---|
| Open | $87,000 | ||
| Previous Owner | $114,000 | ||
| Previous Owner | $76,475 | ||
| Previous Owner | $50,250 | ||
| Previous Owner | $217,500 |
Tax History
We collect this data history from publicly available records. To have your information removed, we recommend requesting removal directly through your county’s website.
| Year | Tax Paid | Tax Assessment Tax Assessment Total Assessment is a certain percentage of the fair market value that is determined by local assessors to be the total taxable value of land and additions on the property. | Land | Improvement |
|---|---|---|---|---|
| 2025 | $2,104 | $66,800 | $0 | $0 |
| 2024 | $20 | $61,700 | $0 | $0 |
| 2023 | $2,679 | $56,600 | $0 | $0 |
| 2022 | $2,546 | $49,100 | $0 | $0 |
| 2021 | $2,521 | $48,300 | $0 | $0 |
| 2020 | $1,410 | $47,400 | $0 | $0 |
| 2019 | $1,477 | $45,400 | $0 | $0 |
| 2018 | $1,426 | $44,400 | $0 | $0 |
| 2017 | $1,389 | $39,800 | $0 | $0 |
| 2016 | $1,406 | $36,400 | $0 | $0 |
| 2015 | $1,861 | $36,400 | $0 | $0 |
| 2013 | -- | $32,800 | $0 | $0 |
About Hillmount
Map
- 623 Cherry St SE
- 304 Paris Ave SE
- 340 Cherry St SE
- 244 Prospect Ave SE
- 254 James Ave SE
- 666 Lake Dr SE
- 643 Lake Dr SE
- 427 James Ave SE
- 44 Lafayette Ave NE Unit 3
- 218 Wellington Ave SE
- 233 Hollister Ave SE
- 130 College Ave NE
- 151 Union Ave NE
- 300 Eureka Ave SE
- 921 Fairmount St SE
- 710 Baxter St SE
- 712 Baxter St SE
- 556 Lafayette Ave SE
- 510 La Grave Ave SE
- 52 Batavia Place NE
- 505 Cherry St SE
- 505 Cherry St SE
- 505 Cherry St SE
- 505 Cherry St SE
- 505 Cherry St SE
- 505 Cherry St SE Unit 99
- 505 Cherry St SE
- 505 Cherry St SE Unit 95
- 505 Cherry St SE
- 505 Cherry St SE
- 505 Cherry St SE
- 505 Cherry St SE Unit 91
- 505 Cherry St SE
- 505 Cherry St SE Unit 88
- 505 Cherry St SE
- 505 Cherry St SE Unit 86
- 505 Cherry St SE
- 505 Cherry St SE Unit 84
- 505 Cherry St SE
- 505 Cherry St SE Unit 82
Ask me questions while you tour the home.