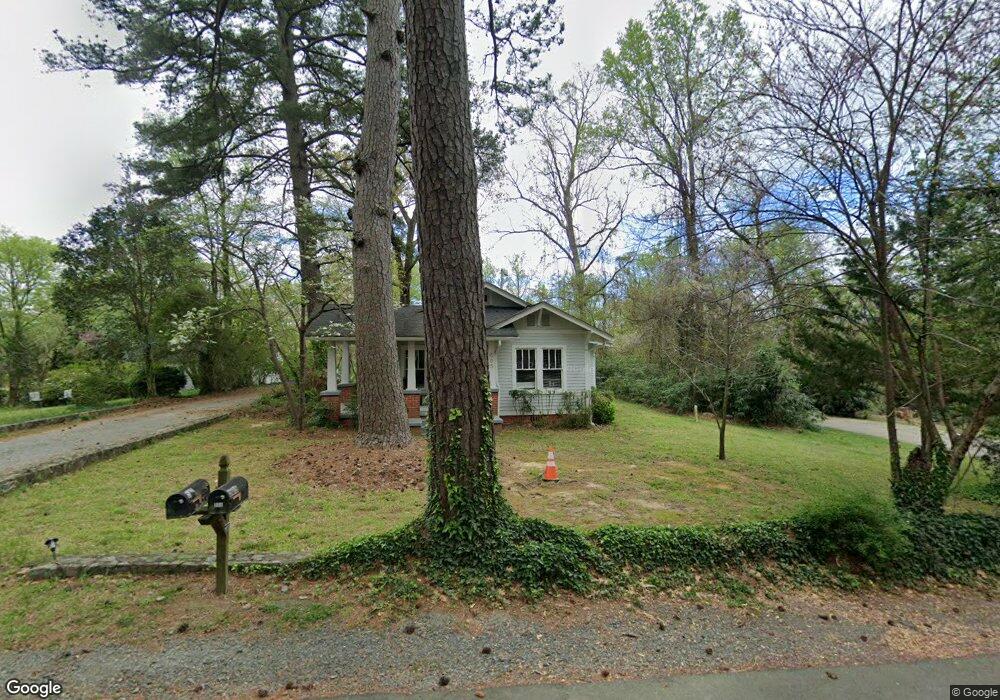
505 Coolidge St Unit C Chapel Hill, NC 27516
Estimated Value: $518,000 - $655,086
3
Beds
3
Baths
1,964
Sq Ft
$297/Sq Ft
Est. Value
About This Home
This home is located at 505 Coolidge St Unit C, Chapel Hill, NC 27516 and is currently estimated at $583,772, approximately $297 per square foot. 505 Coolidge St Unit C is a home located in Orange County with nearby schools including Smith Middle School, East Chapel Hill High School, and St. Thomas More Catholic School.
Ownership History
Date
Name
Owned For
Owner Type
Purchase Details
Closed on
Apr 1, 2025
Sold by
Morris Edwin Lee and Morris Barbara D
Bought by
Stewart Abel Living Trust and Abel
Current Estimated Value
Purchase Details
Closed on
Nov 6, 2020
Sold by
Markovic Plese Silv and Plese Zlatko
Bought by
Morris Edwin Lee and Morris Barbara D
Home Financials for this Owner
Home Financials are based on the most recent Mortgage that was taken out on this home.
Original Mortgage
$300,000
Interest Rate
2.8%
Mortgage Type
New Conventional
Purchase Details
Closed on
Jun 30, 2003
Sold by
Porcupine Properties Llc
Bought by
Markovic Plese Silva and Plese Zlatko
Home Financials for this Owner
Home Financials are based on the most recent Mortgage that was taken out on this home.
Original Mortgage
$240,000
Interest Rate
5.43%
Mortgage Type
Purchase Money Mortgage
Create a Home Valuation Report for This Property
The Home Valuation Report is an in-depth analysis detailing your home's value as well as a comparison with similar homes in the area
Home Values in the Area
Average Home Value in this Area
Purchase History
| Date | Buyer | Sale Price | Title Company |
|---|---|---|---|
| Stewart Abel Living Trust | $515,000 | None Listed On Document | |
| Morris Edwin Lee | $375,000 | None Available | |
| Markovic Plese Silva | $300,000 | -- |
Source: Public Records
Mortgage History
| Date | Status | Borrower | Loan Amount |
|---|---|---|---|
| Previous Owner | Morris Edwin Lee | $300,000 | |
| Previous Owner | Markovic Plese Silva | $240,000 | |
| Closed | Markovic Plese Silva | $60,000 |
Source: Public Records
Tax History Compared to Growth
Tax History
| Year | Tax Paid | Tax Assessment Tax Assessment Total Assessment is a certain percentage of the fair market value that is determined by local assessors to be the total taxable value of land and additions on the property. | Land | Improvement |
|---|---|---|---|---|
| 2025 | $7,199 | $534,900 | $270,000 | $264,900 |
| 2024 | $7,031 | $407,500 | $198,000 | $209,500 |
| 2023 | $6,841 | $407,500 | $198,000 | $209,500 |
| 2022 | $6,516 | $404,700 | $198,000 | $206,700 |
| 2021 | $6,259 | $393,200 | $198,000 | $195,200 |
| 2020 | $6,102 | $359,600 | $176,000 | $183,600 |
| 2018 | $5,959 | $359,600 | $176,000 | $183,600 |
| 2017 | $5,978 | $359,600 | $176,000 | $183,600 |
| 2016 | $5,978 | $357,248 | $62,835 | $294,413 |
| 2015 | $5,978 | $357,248 | $62,835 | $294,413 |
| 2014 | $5,932 | $357,248 | $62,835 | $294,413 |
Source: Public Records
Map
Nearby Homes
- 619 Coolidge St Unit A And B
- 409 Smith Ave Unit 102
- 409 Smith Ave Unit 103
- 409 Smith Ave Unit 105
- 101 Braswell Ct
- 106 Braswell Ct
- 110 Marin Dr
- 721 S Merritt Mill Rd
- 121 Purefoy Rd
- 417 Westbury Dr
- 104 Windorah Place
- 112 Old Bridge Ln
- 125 Mallard Ct
- 122 Mallard Ct
- 212 W University Dr
- 225 Vance St
- 401 Westbury Dr
- 126 Johnson St
- 112 Mallard Ct
- 302 Edgewater Cir
- 505 Coolidge St Unit D
- 505 Coolidge St
- 507 Coolidge St
- 505 D Coolidge St
- 1002 Dawes St
- 505 C Coolidge St
- 503 Coolidge St
- 500 Pine Bluff Trail
- 509 Coolidge St
- 509 Coolidge St Unit A
- 509 Coolidge St Unit B
- 511 Coolidge St
- 1004 Dawes St
- 504 Coolidge St Unit A
- 504 Coolidge St Unit A & B
- 502 Coolidge St Unit A
- 502 Coolidge St Unit B
- 501 Coolidge St
- 503 Pine Bluff Trail
- 505 Pine Bluff Trail