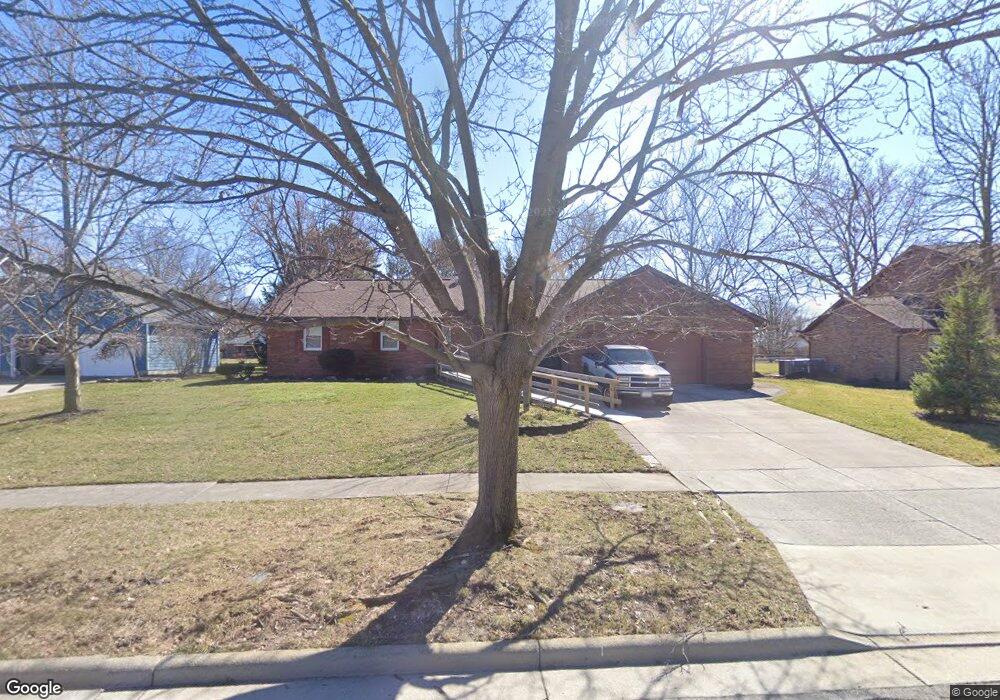
505 Coventry Dr Findlay, OH 45840
Estimated Value: $312,000 - $356,000
5
Beds
3
Baths
1,950
Sq Ft
$172/Sq Ft
Est. Value
About This Home
This home is located at 505 Coventry Dr, Findlay, OH 45840 and is currently estimated at $336,330, approximately $172 per square foot. 505 Coventry Dr is a home located in Hancock County with nearby schools including Chamberlin Hill Elementary School, Jefferson Elementary School, and Donnell Middle School.
Ownership History
Date
Name
Owned For
Owner Type
Purchase Details
Closed on
Jun 28, 2004
Sold by
Billerman George R and Billerman Pamela R
Bought by
Billerman George R and Billerman Pamela R
Current Estimated Value
Purchase Details
Closed on
Oct 10, 2001
Sold by
Current Leslie J
Bought by
Billerman George and Billerman Pamela
Purchase Details
Closed on
Apr 1, 1999
Sold by
Gaiser Mark
Bought by
Current Leslie and Current Lois
Home Financials for this Owner
Home Financials are based on the most recent Mortgage that was taken out on this home.
Original Mortgage
$125,000
Interest Rate
6.89%
Mortgage Type
New Conventional
Purchase Details
Closed on
Mar 2, 1998
Sold by
Baker James
Bought by
Gaiser Mark and Gaiser Darla
Home Financials for this Owner
Home Financials are based on the most recent Mortgage that was taken out on this home.
Original Mortgage
$135,000
Interest Rate
6.95%
Mortgage Type
New Conventional
Purchase Details
Closed on
May 4, 1987
Bought by
Baker James E and Baker Linda D
Purchase Details
Closed on
Jun 30, 1986
Bought by
Wolleson Erma Jean
Purchase Details
Closed on
Jul 13, 1983
Bought by
Feasel Daniel E and Feasel Janet M
Purchase Details
Closed on
Jun 15, 1983
Bought by
Feasel Daniel E and Feasel Janet
Create a Home Valuation Report for This Property
The Home Valuation Report is an in-depth analysis detailing your home's value as well as a comparison with similar homes in the area
Home Values in the Area
Average Home Value in this Area
Purchase History
| Date | Buyer | Sale Price | Title Company |
|---|---|---|---|
| Billerman George R | -- | -- | |
| Billerman George | $188,500 | -- | |
| Current Leslie | $172,500 | -- | |
| Gaiser Mark | $175,000 | -- | |
| Baker James E | $110,500 | -- | |
| Wolleson Erma Jean | $103,500 | -- | |
| Feasel Daniel E | -- | -- | |
| Feasel Daniel E | $79,000 | -- |
Source: Public Records
Mortgage History
| Date | Status | Borrower | Loan Amount |
|---|---|---|---|
| Previous Owner | Current Leslie | $125,000 | |
| Previous Owner | Gaiser Mark | $135,000 |
Source: Public Records
Tax History Compared to Growth
Tax History
| Year | Tax Paid | Tax Assessment Tax Assessment Total Assessment is a certain percentage of the fair market value that is determined by local assessors to be the total taxable value of land and additions on the property. | Land | Improvement |
|---|---|---|---|---|
| 2024 | $2,786 | $88,220 | $13,580 | $74,640 |
| 2023 | $2,812 | $88,220 | $13,580 | $74,640 |
| 2022 | $2,817 | $88,220 | $13,580 | $74,640 |
| 2021 | $2,750 | $76,320 | $13,550 | $62,770 |
| 2020 | $2,750 | $76,320 | $13,550 | $62,770 |
| 2019 | $2,694 | $76,320 | $13,550 | $62,770 |
| 2018 | $2,504 | $66,360 | $11,780 | $54,580 |
| 2017 | $1,252 | $66,360 | $11,780 | $54,580 |
| 2016 | $2,467 | $66,360 | $11,780 | $54,580 |
| 2015 | $2,513 | $66,220 | $10,660 | $55,560 |
| 2014 | $2,513 | $66,220 | $10,660 | $55,560 |
| 2012 | $2,530 | $66,220 | $10,660 | $55,560 |
Source: Public Records
Map
Nearby Homes
- 500 Blue Bonnet Dr
- 164 Church Hill Dr
- 401 Bittersweet Dr
- 200 E Edgar Ave
- 0 Virbunum Ct Unit 87 305267
- 242 E Yates Ave
- 0 Viburnum Ct Unit 6121366
- 0 Viburnum Ct Unit 20243687
- 1705 S Main St
- 211 Fairlawn Place
- 1621 S Main St
- 1727 Washington Ave
- 1421 Hurd Ave
- 3065 S Main St
- 0 Township Road 77
- 3323 Western Ave
- 0 Penrose Dr
- 123 Glendale Ave
- 1115 Liberty St
- 1119 Washington Ave
- 503 Coventry Dr
- 511 Coventry Dr
- 411 Coventry Dr
- 515 Coventry Dr
- 510 Church Hill Dr
- 500 Church Hill Dr
- 506 Coventry Dr
- 518 Church Hill Dr
- 510 Coventry Dr
- 500 Coventry Dr
- 405 Coventry Dr
- 601 Coventry Dr
- 412 Church Hill Dr
- 412 Coventry Dr
- 518 Coventry Dr
- 600 Church Hill Dr
- 401 Coventry Dr
- 611 Coventry Dr
- 406 Church Hill Dr
- 406 Coventry Dr