Estimated Value: $337,783 - $390,000
--
Bed
2
Baths
2,206
Sq Ft
$165/Sq Ft
Est. Value
About This Home
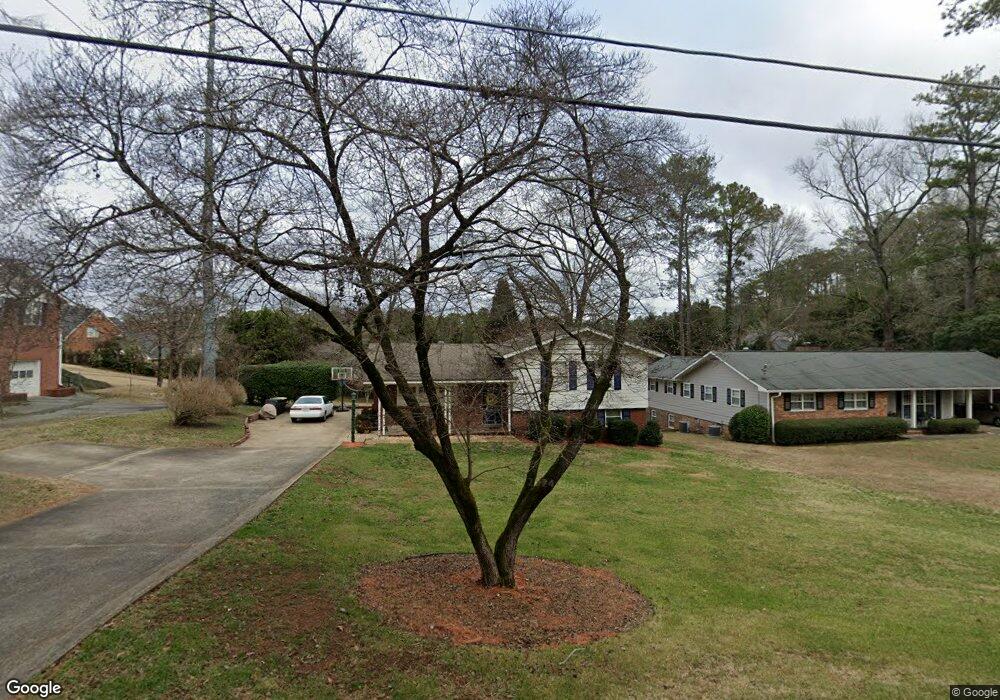
This home is located at 505 E 11th St SE Unit 7, Rome, GA 30161 and is currently estimated at $363,446, approximately $164 per square foot. 505 E 11th St SE Unit 7 is a home located in Floyd County with nearby schools including Rome High School, St. Mary School, and Darlington School.
Ownership History
Date
Name
Owned For
Owner Type
Purchase Details
Closed on
Aug 15, 2013
Sold by
Barron Alfred L
Bought by
Johnson Gary J and Johnson Kelli M
Current Estimated Value
Home Financials for this Owner
Home Financials are based on the most recent Mortgage that was taken out on this home.
Original Mortgage
$157,003
Outstanding Balance
$116,102
Interest Rate
4.25%
Mortgage Type
FHA
Estimated Equity
$247,344
Purchase Details
Closed on
Apr 5, 2002
Sold by
Doss Jamie Lee and Doss Tracy M
Bought by
Barron Alfred L
Purchase Details
Closed on
Dec 15, 1995
Sold by
Dempsey Dallas W
Bought by
Doss Jamie Lee and Doss Tracy M
Purchase Details
Closed on
Feb 21, 1972
Sold by
Dempsey Louise Ray
Bought by
Dempsey Dallas W
Purchase Details
Closed on
May 3, 1968
Sold by
Lucas Wm H
Bought by
Dempsey Louise Ray
Purchase Details
Closed on
Dec 5, 1963
Sold by
Byars Mrs Mary Lucille Harry S
Bought by
Lucas Wm H
Purchase Details
Closed on
Feb 1, 1959
Bought by
Byars Mrs Mary Lucille Harry S
Create a Home Valuation Report for This Property
The Home Valuation Report is an in-depth analysis detailing your home's value as well as a comparison with similar homes in the area
Home Values in the Area
Average Home Value in this Area
Purchase History
| Date | Buyer | Sale Price | Title Company |
|---|---|---|---|
| Johnson Gary J | $159,900 | -- | |
| Barron Alfred L | $129,900 | -- | |
| Doss Jamie Lee | $110,000 | -- | |
| P | -- | -- | |
| Dempsey Dallas W | $5,800 | -- | |
| Dempsey Louise Ray | $28,500 | -- | |
| Lucas Wm H | -- | -- | |
| Byars Mrs Mary Lucille Harry S | -- | -- |
Source: Public Records
Mortgage History
| Date | Status | Borrower | Loan Amount |
|---|---|---|---|
| Open | Johnson Gary J | $157,003 |
Source: Public Records
Tax History Compared to Growth
Tax History
| Year | Tax Paid | Tax Assessment Tax Assessment Total Assessment is a certain percentage of the fair market value that is determined by local assessors to be the total taxable value of land and additions on the property. | Land | Improvement |
|---|---|---|---|---|
| 2024 | $3,127 | $120,672 | $13,992 | $106,680 |
| 2023 | $3,107 | $111,144 | $12,720 | $98,424 |
| 2022 | $2,704 | $91,894 | $10,494 | $81,400 |
| 2021 | $2,596 | $83,495 | $10,494 | $73,001 |
| 2020 | $2,505 | $77,252 | $7,950 | $69,302 |
| 2019 | $2,415 | $73,379 | $7,950 | $65,429 |
| 2018 | $2,345 | $69,372 | $7,950 | $61,422 |
| 2017 | $2,272 | $65,148 | $7,950 | $57,198 |
| 2016 | $2,257 | $63,940 | $7,920 | $56,020 |
| 2015 | $1,923 | $59,740 | $7,920 | $51,820 |
| 2014 | $1,923 | $60,420 | $7,920 | $52,500 |
Source: Public Records
Map
Nearby Homes
- 14 Gables Dr SE
- 1 Vassar Dr SE
- 46 Turnbull Dr SE
- 0 Turnbull Dr SE Unit 10570009
- 12 Turnbull Dr SE
- 13 Townview Rd SE
- 22 Townview Rd SE
- 2 Laporte St SE
- 211 E 11th St SE
- 1103 E 2nd Ave SE
- 1314 E 2nd Ave SE
- 411 Cooper Dr SE
- 6 Haley Dr SE
- 1 Joe Louis Blvd SE
- 311 Roswell Ave SE
- 31 Notasulga Dr SW
- 210 E 9th St SW
- 22 Oakfield Dr SE
- 26 Maplewood Square SE
- 74 Dodd Blvd SE
- 505 E 11th St SE
- 507 E 11th St SE
- 503 E 11th St SE
- 113 Vinings Dr SE
- 112 Vinings Dr SE
- 509 E 11th St SE
- 114 Vinings Ct SE
- 111 Vinings Dr SE
- 501 E 11th St SE
- 110 Vinings Dr SE
- 500 E 11th St SE
- 115 Vinings Ct SE
- 511 E 11th St SE
- 506 E 11th St SE
- 419 E 11th St SE
- 109 Vinings Dr SE
- 109 Vinings Dr SE Unit 9
- 153 Vinings Ct SE
- 0 Lenox Cir Unit 7218241
- 0 Lenox Cir Unit 3152682