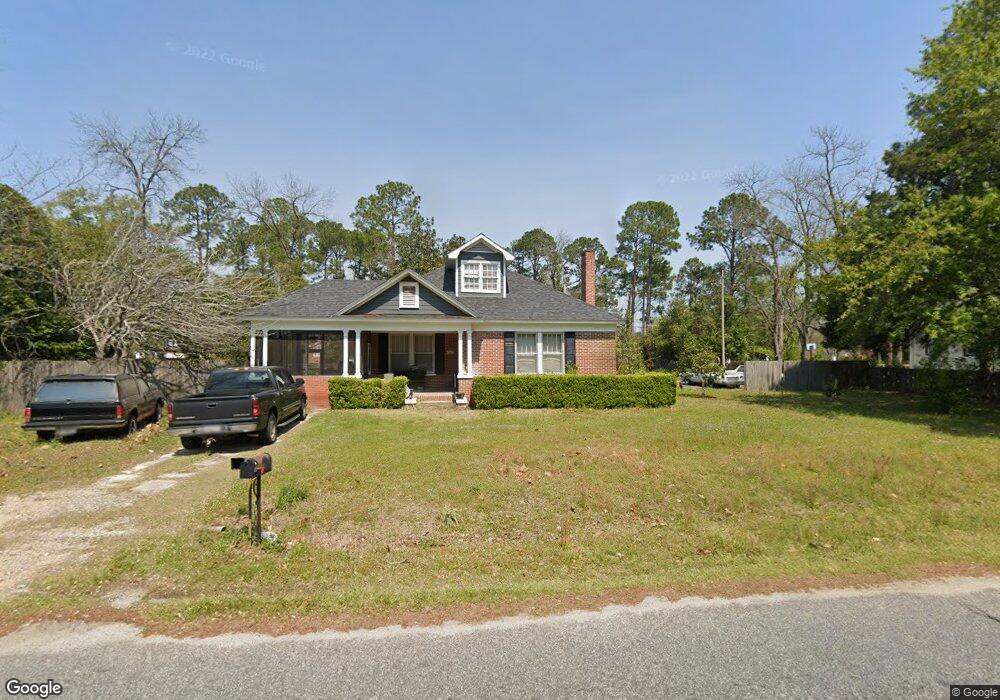
505 E 20th Ave Cordele, GA 31015
Estimated Value: $148,000 - $205,425
4
Beds
2
Baths
2,697
Sq Ft
$63/Sq Ft
Est. Value
About This Home
This home is located at 505 E 20th Ave, Cordele, GA 31015 and is currently estimated at $171,106, approximately $63 per square foot. 505 E 20th Ave is a home located in Crisp County with nearby schools including Crisp County Elementary School, Crisp County Primary School, and Crisp County Middle School.
Ownership History
Date
Name
Owned For
Owner Type
Purchase Details
Closed on
Oct 5, 2004
Sold by
Partin Stephen and Partin Char
Bought by
Partin Stephen A
Current Estimated Value
Purchase Details
Closed on
Jun 11, 1996
Sold by
Harris A H
Bought by
Partin Stephen and Partin Char
Purchase Details
Closed on
Sep 9, 1994
Sold by
Meuth Troy D and Meuth Lisa
Bought by
Meuth Troy D and Meuth Lisa
Purchase Details
Closed on
Aug 1, 1994
Sold by
Harris A H Jr Mrs
Bought by
Meuth Troy D and Meuth Lisa
Purchase Details
Closed on
Oct 10, 1961
Sold by
Harris Nella R Mrs
Bought by
Harris A H Jr Mrs
Create a Home Valuation Report for This Property
The Home Valuation Report is an in-depth analysis detailing your home's value as well as a comparison with similar homes in the area
Home Values in the Area
Average Home Value in this Area
Purchase History
| Date | Buyer | Sale Price | Title Company |
|---|---|---|---|
| Partin Stephen A | -- | -- | |
| Partin Stephen | -- | -- | |
| Partin Stephen | $76,000 | -- | |
| Meuth Troy D | -- | -- | |
| Meuth Troy D | $66,000 | -- | |
| Harris A H Jr Mrs | -- | -- |
Source: Public Records
Tax History Compared to Growth
Tax History
| Year | Tax Paid | Tax Assessment Tax Assessment Total Assessment is a certain percentage of the fair market value that is determined by local assessors to be the total taxable value of land and additions on the property. | Land | Improvement |
|---|---|---|---|---|
| 2025 | $1,830 | $55,136 | $5,480 | $49,656 |
| 2024 | $1,830 | $51,070 | $5,480 | $45,590 |
| 2023 | $1,741 | $46,424 | $2,740 | $43,684 |
| 2022 | $1,173 | $44,391 | $2,740 | $41,651 |
| 2021 | $1,150 | $42,055 | $2,740 | $39,315 |
| 2020 | $1,184 | $42,055 | $2,740 | $39,315 |
| 2019 | $1,193 | $42,055 | $2,740 | $39,315 |
| 2018 | $1,003 | $34,018 | $5,206 | $28,812 |
| 2017 | $1,383 | $34,050 | $5,206 | $28,844 |
| 2016 | $1,007 | $34,050 | $5,206 | $28,844 |
| 2015 | -- | $34,050 | $5,206 | $28,844 |
| 2014 | -- | $34,050 | $5,206 | $28,844 |
| 2013 | -- | $34,049 | $5,206 | $28,843 |
Source: Public Records
Map
Nearby Homes