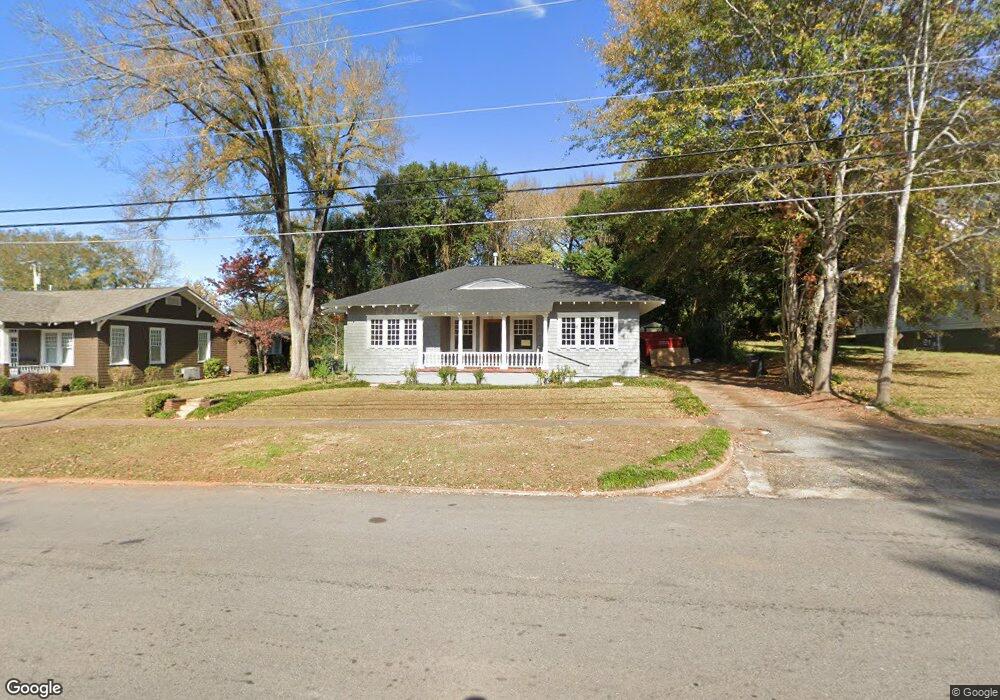
505 E 7th St West Point, GA 31833
Estimated Value: $96,000 - $143,000
3
Beds
2
Baths
1,954
Sq Ft
$62/Sq Ft
Est. Value
About This Home
This home is located at 505 E 7th St, West Point, GA 31833 and is currently estimated at $121,220, approximately $62 per square foot. 505 E 7th St is a home located in Troup County with nearby schools including West Point Elementary School, Long Cane Elementary School, and Whitesville Road Elementary School.
Ownership History
Date
Name
Owned For
Owner Type
Purchase Details
Closed on
Apr 7, 1989
Sold by
Powers Joseph and Powers Malinda C
Bought by
Rearden Kenneth
Current Estimated Value
Purchase Details
Closed on
Jul 6, 1984
Sold by
Margaret Grover and Margaret Batson
Bought by
Powers Joseph and Powers Malinda C
Purchase Details
Closed on
Jun 7, 1979
Sold by
Wanda Robert and Wanda Loftin
Bought by
Margaret Grover and Margaret Batson
Purchase Details
Closed on
Apr 18, 1978
Sold by
Dianne S Cooper
Bought by
Wanda Robert and Wanda Loftin
Purchase Details
Closed on
Apr 15, 1976
Sold by
Barry R Cooper
Bought by
Dianne S Cooper
Purchase Details
Closed on
Jul 1, 1975
Sold by
Verlie B Mackool
Bought by
Barry R Cooper
Purchase Details
Closed on
Jan 1, 1972
Sold by
Keith Wood C
Bought by
Verlie B Mackool
Purchase Details
Closed on
Jan 1, 1962
Sold by
Walter S Lee
Bought by
Keith Wood C
Create a Home Valuation Report for This Property
The Home Valuation Report is an in-depth analysis detailing your home's value as well as a comparison with similar homes in the area
Home Values in the Area
Average Home Value in this Area
Purchase History
| Date | Buyer | Sale Price | Title Company |
|---|---|---|---|
| Rearden Kenneth | $46,000 | -- | |
| Powers Joseph | -- | -- | |
| Margaret Grover | -- | -- | |
| Wanda Robert | -- | -- | |
| Dianne S Cooper | -- | -- | |
| Barry R Cooper | -- | -- | |
| Verlie B Mackool | -- | -- | |
| Keith Wood C | -- | -- |
Source: Public Records
Tax History
| Year | Tax Paid | Tax Assessment Tax Assessment Total Assessment is a certain percentage of the fair market value that is determined by local assessors to be the total taxable value of land and additions on the property. | Land | Improvement |
|---|---|---|---|---|
| 2025 | $1,411 | $47,804 | $2,640 | $45,164 |
| 2024 | $1,411 | $39,884 | $2,640 | $37,244 |
| 2023 | $1,427 | $40,084 | $2,640 | $37,444 |
| 2022 | $1,051 | $37,644 | $2,640 | $35,004 |
| 2021 | $993 | $32,924 | $2,640 | $30,284 |
| 2020 | $863 | $28,612 | $1,400 | $27,212 |
| 2019 | $796 | $26,396 | $1,428 | $24,968 |
| 2018 | $760 | $25,192 | $1,428 | $23,764 |
| 2017 | $760 | $25,192 | $1,428 | $23,764 |
| 2016 | $738 | $24,479 | $1,428 | $23,051 |
| 2015 | $740 | $24,479 | $1,428 | $23,051 |
| 2014 | $704 | $23,266 | $1,428 | $21,838 |
| 2013 | -- | $24,841 | $1,428 | $23,413 |
Source: Public Records
Map
Nearby Homes
- 713 Avenue H
- 1202 E 9th St
- 1105 E 7th St
- 1104 E 8th St
- 311 E 4th St
- 0 Arrowhead Dr Unit 10451860
- 509 Cleveland St
- 112 Hillcrest Rd
- 712 4th Ave
- 128 Highland Dr
- 1007 4th Ave
- 0 Sunset Dr Unit 10451831
- 210 N 14th St
- 1314 4th Ave
- 1508 N 4th Ave
- 1026 N 6th Ave
- 514 N 8th Ave
- 1800 Malco Dr
- 811 Cherry Dr
- 508 Pine St
Your Personal Tour Guide
Ask me questions while you tour the home.