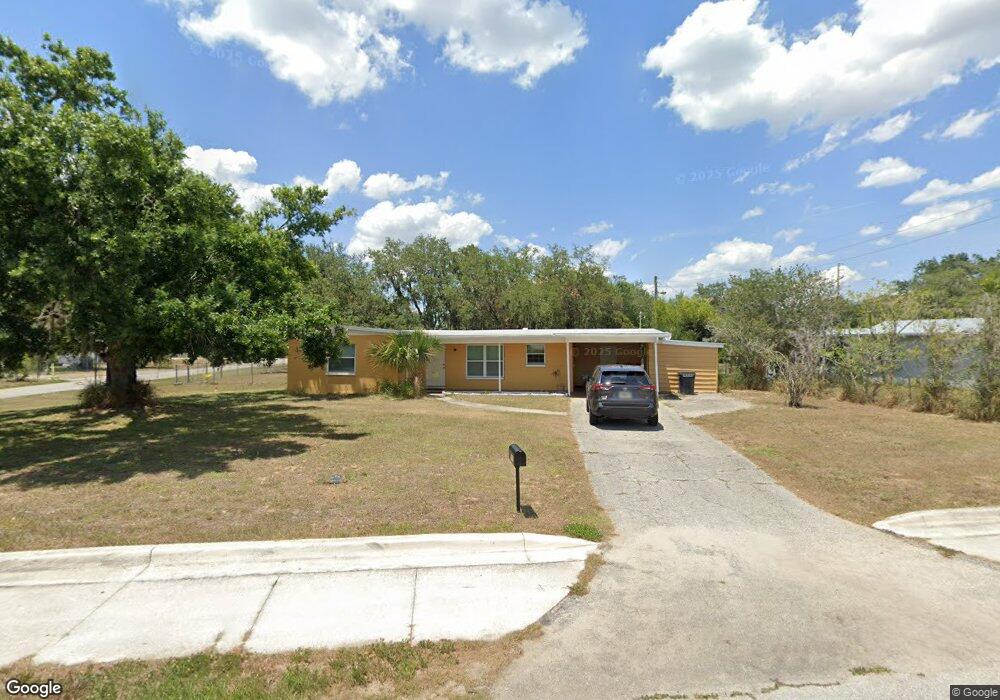
505 E Canfield St Avon Park, FL 33825
Estimated Value: $153,000 - $178,000
2
Beds
2
Baths
1,296
Sq Ft
$124/Sq Ft
Est. Value
About This Home
This home is located at 505 E Canfield St, Avon Park, FL 33825 and is currently estimated at $160,973, approximately $124 per square foot. 505 E Canfield St is a home located in Highlands County with nearby schools including Avon Park High School, Park Elementary School, and Avon Park Middle School.
Ownership History
Date
Name
Owned For
Owner Type
Purchase Details
Closed on
Jun 14, 2007
Sold by
Malcolm Emma
Bought by
Degand Yves O and Degand Paulette
Current Estimated Value
Purchase Details
Closed on
Jun 11, 2007
Sold by
Scriven Paul H
Bought by
Degand Yves O and Degand Paulette
Purchase Details
Closed on
Jun 30, 2006
Sold by
Marquez Julio and Sanchez Francisca
Bought by
Degand Yves and Degand Paulette
Home Financials for this Owner
Home Financials are based on the most recent Mortgage that was taken out on this home.
Original Mortgage
$105,450
Interest Rate
6.57%
Mortgage Type
Purchase Money Mortgage
Purchase Details
Closed on
Jan 25, 2005
Sold by
Gobourne Donovan Anthony
Bought by
Marquez Julio and Sanchez Francisca
Home Financials for this Owner
Home Financials are based on the most recent Mortgage that was taken out on this home.
Original Mortgage
$61,000
Interest Rate
11.75%
Mortgage Type
Purchase Money Mortgage
Purchase Details
Closed on
Aug 26, 2002
Sold by
Ogilvie Lilla J and Ogilvie Alexander W
Bought by
Gobourne Donovan Anthony and Gobourne Jacqueline
Home Financials for this Owner
Home Financials are based on the most recent Mortgage that was taken out on this home.
Original Mortgage
$44,600
Interest Rate
11.75%
Create a Home Valuation Report for This Property
The Home Valuation Report is an in-depth analysis detailing your home's value as well as a comparison with similar homes in the area
Home Values in the Area
Average Home Value in this Area
Purchase History
| Date | Buyer | Sale Price | Title Company |
|---|---|---|---|
| Degand Yves O | $1,500 | Stewart Title Guaranty Co | |
| Degand Yves O | $1,500 | Stewart Title Guaranty Co | |
| Degand Yves | $111,000 | Heartland Title Insurance Ag | |
| Marquez Julio | $61,000 | South Ridge Abstract & Title | |
| Gobourne Donovan Anthony | $45,900 | -- |
Source: Public Records
Mortgage History
| Date | Status | Borrower | Loan Amount |
|---|---|---|---|
| Previous Owner | Degand Yves | $105,450 | |
| Previous Owner | Marquez Julio | $61,000 | |
| Previous Owner | Gobourne Donovan Anthony | $44,600 |
Source: Public Records
Tax History
| Year | Tax Paid | Tax Assessment Tax Assessment Total Assessment is a certain percentage of the fair market value that is determined by local assessors to be the total taxable value of land and additions on the property. | Land | Improvement |
|---|---|---|---|---|
| 2025 | $2,042 | $122,644 | $7,395 | $115,249 |
| 2024 | $1,836 | $127,286 | $4,437 | $122,849 |
| 2023 | $1,836 | $85,438 | $0 | $0 |
| 2022 | $1,655 | $95,388 | $4,437 | $90,951 |
| 2021 | $1,340 | $73,101 | $4,437 | $68,664 |
| 2020 | $1,132 | $64,191 | $0 | $0 |
| 2019 | $1,006 | $58,647 | $0 | $0 |
| 2018 | $0 | $52,318 | $0 | $0 |
| 2017 | $839 | $48,297 | $0 | $0 |
| 2016 | $806 | $45,000 | $0 | $0 |
| 2015 | $834 | $42,356 | $0 | $0 |
| 2014 | $839 | $0 | $0 | $0 |
Source: Public Records
Map
Nearby Homes
- 1794 E Canfield St
- 426 Las Palmas Cir Unit 617
- 39 Forest Hill Ct
- 401 E Canfield St
- 307 Blanco Ct Unit 635
- 407 E Citico St
- 406 E Citico St
- 313 E Canfield St
- 606 E Cornell St
- 413 E Main St
- 3 A Miracle Ave
- 3 A Miracle Ave Unit D
- 7 A Miracle Ave
- 17 A Miracle Ave
- 503 Rich St
- 907 S Palmer Ave
- 113 E State St
- 118 E Bell(gwen Hill) St
- 310 E Booker St
- 480 E Lakeview Dr
- 507 E Canfield St
- 603 Cherokee Cir
- 501 E Canfield St
- 504 E Canfield St
- 600 Cherokee Cir
- 502 E Canfield St
- 506 E Canfield St
- 500 E Canfield St
- 605 Cherokee Cir
- 508 E Canfield St
- 602 Cherokee Cir
- 511 E Canfield St
- 415 E Canfield St
- 365 S Pine Hill Ave
- 510 E Canfield St
- 416 E Camphor St
- 363 S Pine Hill Ave
- 503 Ed Carter St
- 607 Cherokee Cir
- 501 Ed Carter St
Your Personal Tour Guide
Ask me questions while you tour the home.