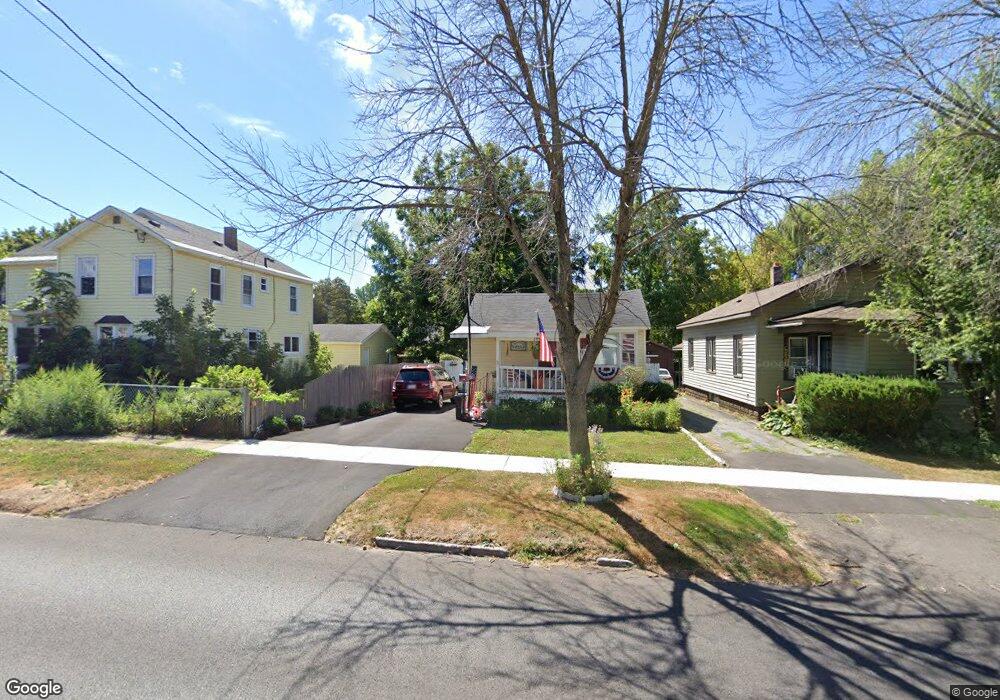
505 Hannibal St Fulton, NY 13069
Estimated Value: $84,000 - $111,000
2
Beds
1
Bath
735
Sq Ft
$128/Sq Ft
Est. Value
About This Home
This home is located at 505 Hannibal St, Fulton, NY 13069 and is currently estimated at $94,261, approximately $128 per square foot. 505 Hannibal St is a home located in Oswego County with nearby schools including G Ray Bodley High School.
Ownership History
Date
Name
Owned For
Owner Type
Purchase Details
Closed on
May 11, 2010
Sold by
Gray Kathy M
Bought by
Homolka Mark W
Current Estimated Value
Home Financials for this Owner
Home Financials are based on the most recent Mortgage that was taken out on this home.
Original Mortgage
$34,731
Interest Rate
4.44%
Mortgage Type
VA
Purchase Details
Closed on
Apr 27, 2007
Sold by
Woodworth Kathy M and Scharf Patricia A
Bought by
Woodworth Kathy M and Scharf Patricia A
Purchase Details
Closed on
Jul 25, 2001
Sold by
Tallents Diane M
Bought by
Gray Kathy M
Create a Home Valuation Report for This Property
The Home Valuation Report is an in-depth analysis detailing your home's value as well as a comparison with similar homes in the area
Home Values in the Area
Average Home Value in this Area
Purchase History
| Date | Buyer | Sale Price | Title Company |
|---|---|---|---|
| Homolka Mark W | $34,000 | Commonwealth Land Title Insu | |
| Woodworth Kathy M | -- | None Available | |
| Gray Kathy M | $25,500 | P Michael Shanley |
Source: Public Records
Mortgage History
| Date | Status | Borrower | Loan Amount |
|---|---|---|---|
| Closed | Homolka Mark W | $34,731 |
Source: Public Records
Tax History Compared to Growth
Tax History
| Year | Tax Paid | Tax Assessment Tax Assessment Total Assessment is a certain percentage of the fair market value that is determined by local assessors to be the total taxable value of land and additions on the property. | Land | Improvement |
|---|---|---|---|---|
| 2024 | $3,130 | $45,000 | $4,600 | $40,400 |
| 2023 | $2,187 | $45,000 | $4,600 | $40,400 |
| 2022 | $2,028 | $45,000 | $4,600 | $40,400 |
| 2021 | $1,985 | $33,000 | $7,800 | $25,200 |
| 2020 | $1,157 | $33,000 | $7,800 | $25,200 |
| 2019 | $1,122 | $33,000 | $7,800 | $25,200 |
| 2018 | $1,122 | $33,000 | $7,800 | $25,200 |
| 2017 | $1,060 | $32,000 | $7,800 | $24,200 |
| 2016 | $1,059 | $32,000 | $7,800 | $24,200 |
| 2015 | -- | $32,000 | $7,800 | $24,200 |
| 2014 | -- | $32,000 | $7,800 | $24,200 |
Source: Public Records
Map
Nearby Homes