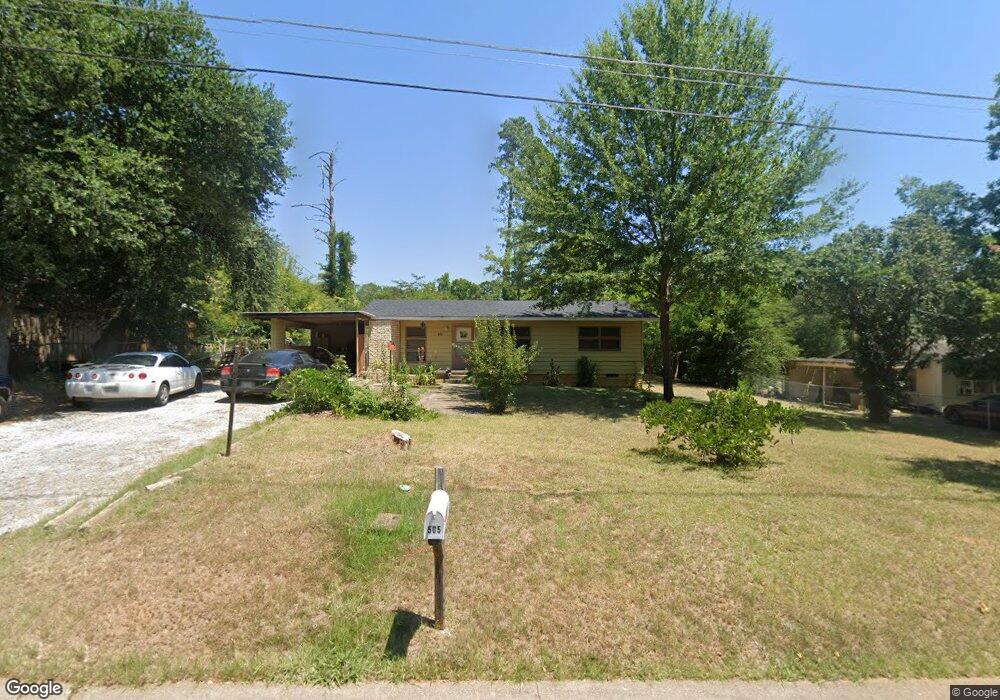
505 Leach St Kilgore, TX 75662
Estimated Value: $115,304 - $154,000
--
Bed
--
Bath
1,144
Sq Ft
$120/Sq Ft
Est. Value
About This Home
This home is located at 505 Leach St, Kilgore, TX 75662 and is currently estimated at $136,826, approximately $119 per square foot. 505 Leach St is a home located in Rusk County with nearby schools including Kilgore Primary School, Chandler Elementary School, and Kilgore Intermediate School.
Ownership History
Date
Name
Owned For
Owner Type
Purchase Details
Closed on
Jun 14, 2018
Sold by
Harris Simon
Bought by
Mcfadden Ashley Nicole
Current Estimated Value
Home Financials for this Owner
Home Financials are based on the most recent Mortgage that was taken out on this home.
Original Mortgage
$640
Outstanding Balance
$553
Interest Rate
4.5%
Mortgage Type
Purchase Money Mortgage
Estimated Equity
$136,273
Purchase Details
Closed on
Jul 31, 2013
Sold by
Carpenter Ledell
Bought by
Harris Simona
Create a Home Valuation Report for This Property
The Home Valuation Report is an in-depth analysis detailing your home's value as well as a comparison with similar homes in the area
Home Values in the Area
Average Home Value in this Area
Purchase History
| Date | Buyer | Sale Price | Title Company |
|---|---|---|---|
| Mcfadden Ashley Nicole | $86,500 | None Available | |
| Harris Simona | -- | None Available |
Source: Public Records
Mortgage History
| Date | Status | Borrower | Loan Amount |
|---|---|---|---|
| Open | Mcfadden Ashley Nicole | $640 |
Source: Public Records
Tax History Compared to Growth
Tax History
| Year | Tax Paid | Tax Assessment Tax Assessment Total Assessment is a certain percentage of the fair market value that is determined by local assessors to be the total taxable value of land and additions on the property. | Land | Improvement |
|---|---|---|---|---|
| 2024 | $1,671 | $81,460 | $25,000 | $56,460 |
| 2023 | $1,496 | $68,370 | $20,000 | $48,370 |
| 2022 | $1,504 | $57,710 | $15,000 | $42,710 |
| 2021 | $1,277 | $54,630 | $15,000 | $39,630 |
| 2020 | $1,161 | $45,700 | $6,000 | $39,700 |
| 2019 | $1,192 | $45,750 | $6,000 | $39,750 |
| 2018 | $1,699 | $63,740 | $6,000 | $57,740 |
| 2017 | $1,641 | $63,740 | $6,000 | $57,740 |
| 2016 | $1,568 | $63,740 | $6,000 | $57,740 |
| 2015 | -- | $63,740 | $6,000 | $57,740 |
| 2014 | -- | $60,930 | $6,000 | $54,930 |
Source: Public Records
Map
Nearby Homes