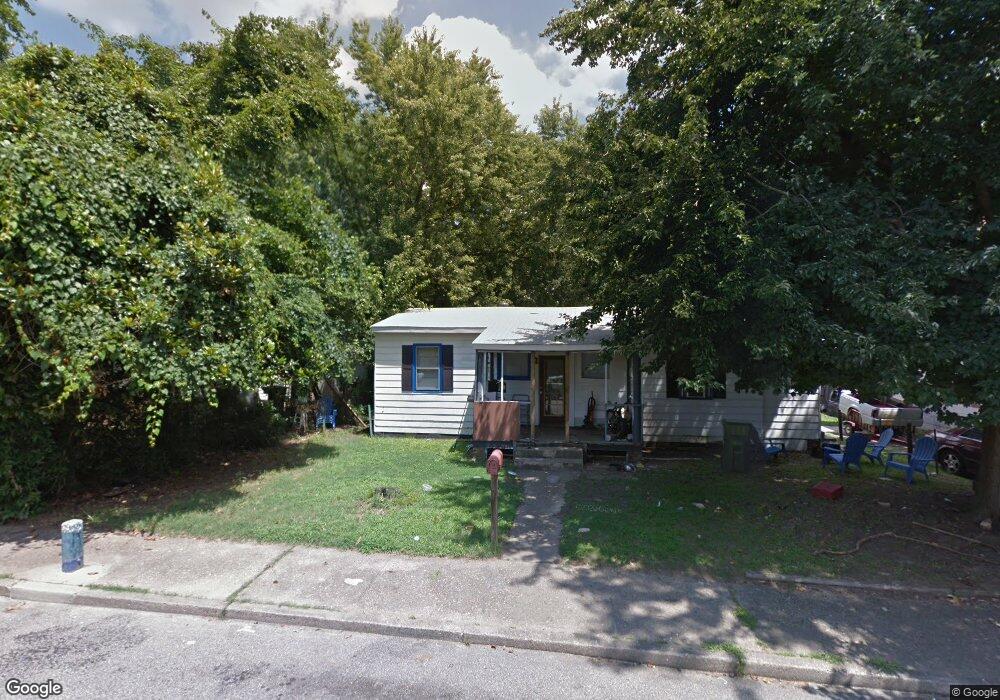
505 N 8th Ave Hopewell, VA 23860
Estimated Value: $93,000 - $158,000
3
Beds
1
Bath
1,021
Sq Ft
$124/Sq Ft
Est. Value
About This Home
This home is located at 505 N 8th Ave, Hopewell, VA 23860 and is currently estimated at $126,421, approximately $123 per square foot. 505 N 8th Ave is a home located in Hopewell City with nearby schools including Carter G. Woodson Middle School, Hopewell High School, and West End Christian School.
Ownership History
Date
Name
Owned For
Owner Type
Purchase Details
Closed on
May 13, 2024
Sold by
Millennium Property Llc
Bought by
Urquta Gloria Gabriela Mar
Current Estimated Value
Home Financials for this Owner
Home Financials are based on the most recent Mortgage that was taken out on this home.
Original Mortgage
$85,000
Outstanding Balance
$83,857
Interest Rate
7.1%
Mortgage Type
New Conventional
Estimated Equity
$42,564
Purchase Details
Closed on
Aug 22, 2019
Sold by
Medrano Yeylt
Bought by
Millenium Property Llc
Purchase Details
Closed on
Jan 8, 2016
Sold by
Roadrunner Enterprises Inc
Bought by
Orellana Yeyli Mendrano
Purchase Details
Closed on
Aug 21, 2006
Sold by
Lewis Harry V
Bought by
Roadrunner Enterprises Inc
Home Financials for this Owner
Home Financials are based on the most recent Mortgage that was taken out on this home.
Original Mortgage
$50,000
Interest Rate
6.88%
Mortgage Type
New Conventional
Create a Home Valuation Report for This Property
The Home Valuation Report is an in-depth analysis detailing your home's value as well as a comparison with similar homes in the area
Home Values in the Area
Average Home Value in this Area
Purchase History
| Date | Buyer | Sale Price | Title Company |
|---|---|---|---|
| Urquta Gloria Gabriela Mar | $95,000 | None Listed On Document | |
| Millenium Property Llc | -- | None Available | |
| Orellana Yeyli Mendrano | $17,050 | First Title & Escrow | |
| Roadrunner Enterprises Inc | $50,000 | -- |
Source: Public Records
Mortgage History
| Date | Status | Borrower | Loan Amount |
|---|---|---|---|
| Open | Urquta Gloria Gabriela Mar | $85,000 | |
| Previous Owner | Roadrunner Enterprises Inc | $50,000 |
Source: Public Records
Tax History Compared to Growth
Tax History
| Year | Tax Paid | Tax Assessment Tax Assessment Total Assessment is a certain percentage of the fair market value that is determined by local assessors to be the total taxable value of land and additions on the property. | Land | Improvement |
|---|---|---|---|---|
| 2025 | $1,097 | $93,800 | $22,000 | $71,800 |
| 2024 | $1,107 | $94,600 | $20,000 | $74,600 |
| 2023 | $1,686 | $94,600 | $20,000 | $74,600 |
| 2022 | $662 | $58,600 | $14,000 | $44,600 |
| 2021 | $662 | $58,600 | $14,000 | $44,600 |
| 2020 | $545 | $48,200 | $14,000 | $34,200 |
| 2019 | $545 | $48,200 | $14,000 | $34,200 |
| 2018 | $489 | $43,300 | $13,900 | $29,400 |
| 2017 | $489 | $43,300 | $13,900 | $29,400 |
| 2016 | $364 | $32,200 | $13,900 | $18,300 |
| 2015 | $364 | $32,200 | $13,900 | $18,300 |
| 2014 | $357 | $32,200 | $13,900 | $18,300 |
Source: Public Records
Map
Nearby Homes