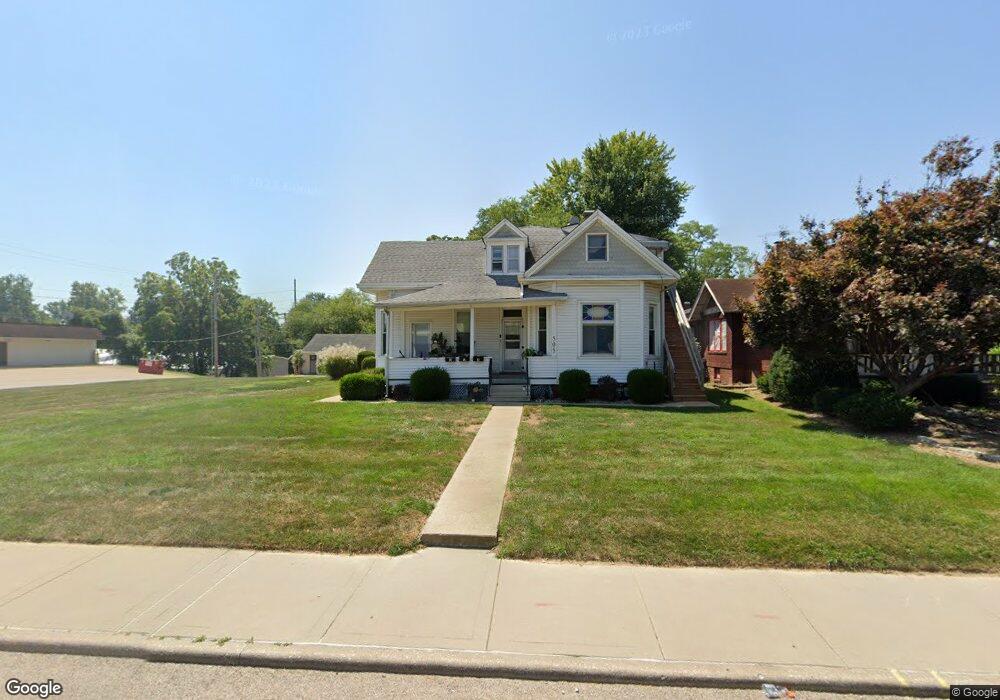
505 N Main St Edwardsville, IL 62025
Estimated Value: $230,000 - $373,000
3
Beds
1
Bath
--
Sq Ft
10,803
Sq Ft Lot
About This Home
This home is located at 505 N Main St, Edwardsville, IL 62025 and is currently estimated at $305,085. 505 N Main St is a home located in Madison County with nearby schools including N.O. Nelson Elementary School, Woodland Elementary School, and Lincoln Middle School.
Ownership History
Date
Name
Owned For
Owner Type
Purchase Details
Closed on
Dec 15, 2020
Sold by
505 Investment Group Llc
Bought by
Eville Portfolio Llc
Current Estimated Value
Purchase Details
Closed on
Jul 1, 2019
Sold by
Beetner Emmet and Beetner Lynne
Bought by
505 Investment Group Llc
Home Financials for this Owner
Home Financials are based on the most recent Mortgage that was taken out on this home.
Original Mortgage
$204,000
Interest Rate
4%
Mortgage Type
New Conventional
Create a Home Valuation Report for This Property
The Home Valuation Report is an in-depth analysis detailing your home's value as well as a comparison with similar homes in the area
Home Values in the Area
Average Home Value in this Area
Purchase History
| Date | Buyer | Sale Price | Title Company |
|---|---|---|---|
| Eville Portfolio Llc | $250,000 | First American Title | |
| 505 Investment Group Llc | $240,000 | Madison County Title |
Source: Public Records
Mortgage History
| Date | Status | Borrower | Loan Amount |
|---|---|---|---|
| Previous Owner | 505 Investment Group Llc | $204,000 |
Source: Public Records
Tax History Compared to Growth
Tax History
| Year | Tax Paid | Tax Assessment Tax Assessment Total Assessment is a certain percentage of the fair market value that is determined by local assessors to be the total taxable value of land and additions on the property. | Land | Improvement |
|---|---|---|---|---|
| 2024 | $5,434 | $76,110 | $17,050 | $59,060 |
| 2023 | $5,434 | $70,630 | $15,820 | $54,810 |
| 2022 | $5,116 | $65,290 | $14,620 | $50,670 |
| 2021 | $4,607 | $61,970 | $13,880 | $48,090 |
| 2020 | $4,467 | $60,050 | $13,450 | $46,600 |
| 2019 | $4,440 | $59,050 | $13,230 | $45,820 |
| 2018 | $4,368 | $56,390 | $12,630 | $43,760 |
| 2017 | $4,256 | $55,190 | $12,360 | $42,830 |
| 2016 | $3,853 | $55,190 | $12,360 | $42,830 |
| 2015 | $3,708 | $51,170 | $11,460 | $39,710 |
| 2014 | $3,708 | $51,170 | $11,460 | $39,710 |
| 2013 | $3,708 | $51,170 | $11,460 | $39,710 |
Source: Public Records
Map
Nearby Homes
- 518 Randle St
- 0 Olive St Unit MAR24057151
- 215 S Benton St
- 612 Cass Ave
- 801 Saint Louis St
- 324 Liberty St
- 603 N Fillmore St
- 911 Grand Ave
- 232 S Main St
- 317 M St
- 608 Hill Ln
- 135 Bunn Ave
- 313 W Linden St
- 668 Chapman St
- 405 Shady Ln
- 401 S Buchanan St
- 408 Cherry St
- 422 Legion Dr
- 300 S Charles St
- 417 Quince St