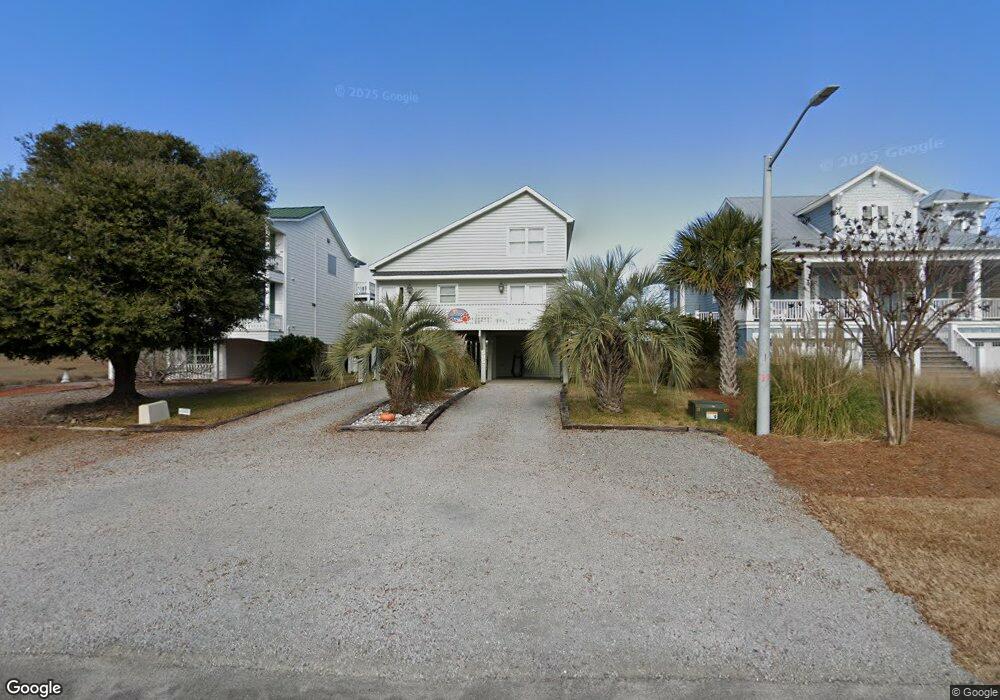
505 N Shore Dr Sunset Beach, NC 28468
Estimated Value: $1,109,000 - $1,228,000
3
Beds
2
Baths
1,469
Sq Ft
$784/Sq Ft
Est. Value
About This Home
This home is located at 505 N Shore Dr, Sunset Beach, NC 28468 and is currently estimated at $1,152,337, approximately $784 per square foot. 505 N Shore Dr is a home located in Brunswick County with nearby schools including Jessie Mae Monroe Elementary School, Shallotte Middle School, and West Brunswick High School.
Ownership History
Date
Name
Owned For
Owner Type
Purchase Details
Closed on
Oct 1, 2014
Sold by
Eastern Shore Land Company Llc
Bought by
Hadley Scott W and Hadley Tricia J
Current Estimated Value
Purchase Details
Closed on
Mar 20, 2009
Sold by
Lynch Tara Lynn
Bought by
Eastern Shore Land Company Llc
Purchase Details
Closed on
Oct 30, 2008
Sold by
Lynch Tara Lynn
Bought by
Lynch Tara Lynn
Create a Home Valuation Report for This Property
The Home Valuation Report is an in-depth analysis detailing your home's value as well as a comparison with similar homes in the area
Home Values in the Area
Average Home Value in this Area
Purchase History
| Date | Buyer | Sale Price | Title Company |
|---|---|---|---|
| Hadley Scott W | $412,500 | None Available | |
| Eastern Shore Land Company Llc | -- | None Available | |
| Lynch Tara Lynn | -- | None Available |
Source: Public Records
Tax History Compared to Growth
Tax History
| Year | Tax Paid | Tax Assessment Tax Assessment Total Assessment is a certain percentage of the fair market value that is determined by local assessors to be the total taxable value of land and additions on the property. | Land | Improvement |
|---|---|---|---|---|
| 2025 | -- | $685,870 | $280,000 | $405,870 |
| 2024 | $3,643 | $685,870 | $280,000 | $405,870 |
| 2023 | $2,837 | $685,870 | $280,000 | $405,870 |
| 2022 | $0 | $410,380 | $180,000 | $230,380 |
| 2021 | $2,837 | $410,380 | $180,000 | $230,380 |
| 2020 | $2,837 | $410,380 | $180,000 | $230,380 |
| 2019 | $2,837 | $185,800 | $180,000 | $5,800 |
| 2018 | $2,829 | $203,500 | $200,000 | $3,500 |
| 2017 | $2,814 | $203,500 | $200,000 | $3,500 |
| 2016 | $2,858 | $203,500 | $200,000 | $3,500 |
| 2015 | $2,789 | $416,960 | $200,000 | $216,960 |
| 2014 | $2,620 | $460,300 | $328,000 | $132,300 |
Source: Public Records
Map
Nearby Homes