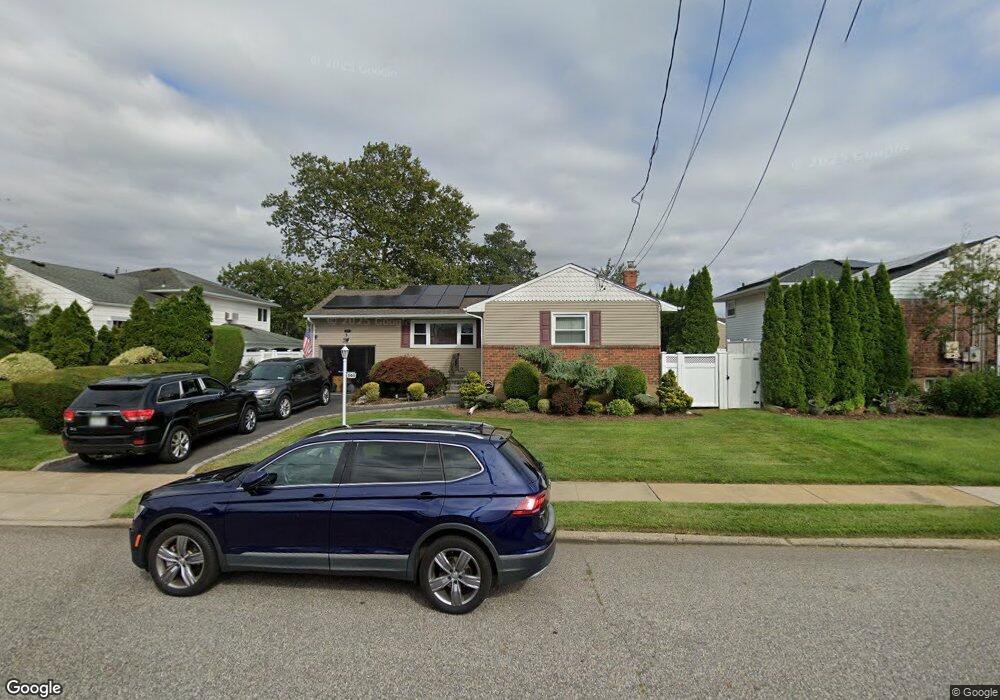
505 Oakdale Ave Massapequa Park, NY 11762
Estimated Value: $723,531 - $755,000
--
Bed
2
Baths
1,144
Sq Ft
$646/Sq Ft
Est. Value
About This Home
This home is located at 505 Oakdale Ave, Massapequa Park, NY 11762 and is currently estimated at $739,266, approximately $646 per square foot. 505 Oakdale Ave is a home located in Nassau County with nearby schools including Albany Avenue Elementary School, Weldon E. Howitt Middle School, and Farmingdale Senior High School.
Ownership History
Date
Name
Owned For
Owner Type
Purchase Details
Closed on
Jun 17, 2022
Sold by
Dobson Walter and Dobson Kathleen
Bought by
Dobson Walter
Current Estimated Value
Purchase Details
Closed on
Mar 19, 2019
Sold by
Dobson Christopher
Bought by
Dobson Keith and Dobson Christopher
Purchase Details
Closed on
Jul 28, 2008
Sold by
Ryan Marc
Bought by
Dobson Walter
Purchase Details
Closed on
Sep 21, 2006
Sold by
Aponte Mary
Bought by
Ryan Marc
Create a Home Valuation Report for This Property
The Home Valuation Report is an in-depth analysis detailing your home's value as well as a comparison with similar homes in the area
Home Values in the Area
Average Home Value in this Area
Purchase History
| Date | Buyer | Sale Price | Title Company |
|---|---|---|---|
| Dobson Walter | -- | Fidelity National Ttl Ins Co | |
| Dobson Keith | -- | First Amer Ttl Ins Co Of Ny | |
| Dobson Christopher | -- | First Amer Ttl Ins Co Of Ny | |
| Dobson Walter | $410,000 | -- | |
| Ryan Marc | $425,000 | -- |
Source: Public Records
Tax History Compared to Growth
Tax History
| Year | Tax Paid | Tax Assessment Tax Assessment Total Assessment is a certain percentage of the fair market value that is determined by local assessors to be the total taxable value of land and additions on the property. | Land | Improvement |
|---|---|---|---|---|
| 2025 | $10,221 | $415 | $182 | $233 |
| 2024 | $2,866 | $422 | $185 | $237 |
| 2023 | $9,937 | $447 | $196 | $251 |
| 2022 | $9,937 | $447 | $196 | $251 |
| 2021 | $9,214 | $431 | $189 | $242 |
| 2020 | $8,468 | $559 | $487 | $72 |
| 2019 | $2,521 | $599 | $502 | $97 |
| 2018 | $5,465 | $623 | $0 | $0 |
| 2017 | $5,465 | $623 | $522 | $101 |
| 2016 | $7,846 | $623 | $496 | $127 |
| 2015 | $2,103 | $623 | $442 | $181 |
| 2014 | $2,103 | $623 | $442 | $181 |
| 2013 | $2,069 | $655 | $465 | $190 |
Source: Public Records
Map
Nearby Homes