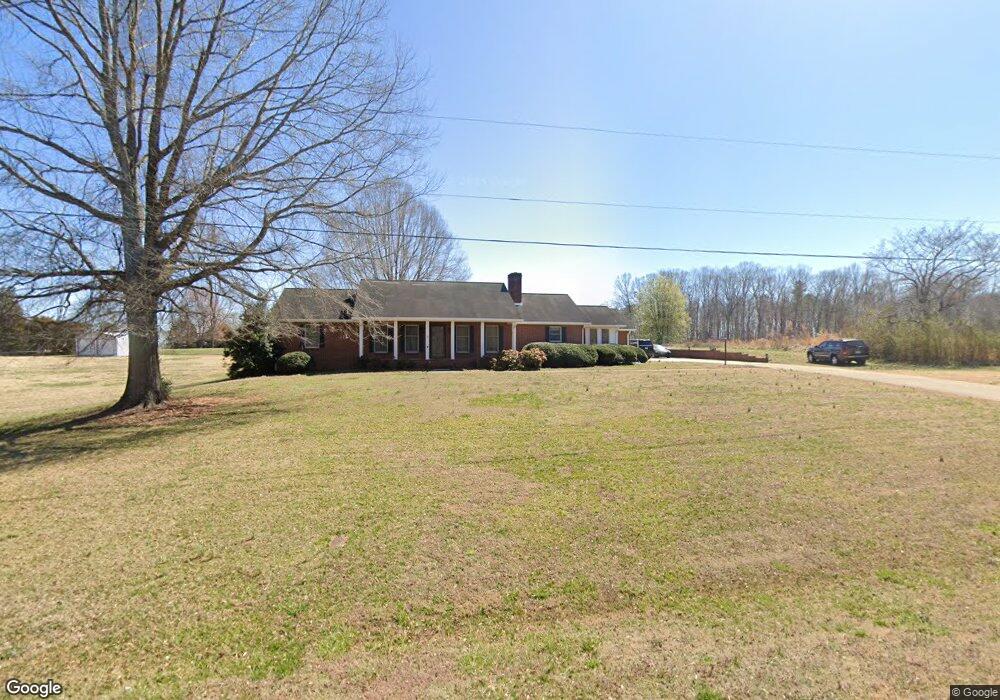
505 Old Boiling Springs Rd Shelby, NC 28152
Estimated Value: $225,000 - $401,000
--
Bed
--
Bath
2,113
Sq Ft
$146/Sq Ft
Est. Value
About This Home
This home is located at 505 Old Boiling Springs Rd, Shelby, NC 28152 and is currently estimated at $307,530, approximately $145 per square foot. 505 Old Boiling Springs Rd is a home located in Cleveland County with nearby schools including Springmore Elementary School, Crest Middle School, and Crest High School.
Ownership History
Date
Name
Owned For
Owner Type
Purchase Details
Closed on
Feb 1, 2021
Sold by
Hamrick James Steven and Hamrick Sandy
Bought by
Macs Five Properties Llc
Current Estimated Value
Purchase Details
Closed on
Nov 24, 2020
Sold by
Hamrick Steve and Linnens Louise H
Bought by
Macs Five Properties Llc
Home Financials for this Owner
Home Financials are based on the most recent Mortgage that was taken out on this home.
Original Mortgage
$115,000
Interest Rate
2.67%
Mortgage Type
Seller Take Back
Purchase Details
Closed on
Nov 23, 2020
Sold by
Mcmurry Larry Blanton
Bought by
Macs Five Properties Llc
Home Financials for this Owner
Home Financials are based on the most recent Mortgage that was taken out on this home.
Original Mortgage
$115,000
Interest Rate
2.67%
Mortgage Type
Seller Take Back
Create a Home Valuation Report for This Property
The Home Valuation Report is an in-depth analysis detailing your home's value as well as a comparison with similar homes in the area
Home Values in the Area
Average Home Value in this Area
Purchase History
| Date | Buyer | Sale Price | Title Company |
|---|---|---|---|
| Macs Five Properties Llc | -- | None Listed On Document | |
| Macs Five Properties Llc | -- | None Listed On Document | |
| Macs Five Properties Llc | $120,000 | None Available |
Source: Public Records
Mortgage History
| Date | Status | Borrower | Loan Amount |
|---|---|---|---|
| Previous Owner | Macs Five Properties Llc | $115,000 |
Source: Public Records
Tax History Compared to Growth
Tax History
| Year | Tax Paid | Tax Assessment Tax Assessment Total Assessment is a certain percentage of the fair market value that is determined by local assessors to be the total taxable value of land and additions on the property. | Land | Improvement |
|---|---|---|---|---|
| 2025 | $2,001 | $315,071 | $19,969 | $295,102 |
| 2024 | $1,716 | $205,751 | $16,904 | $188,847 |
| 2023 | $1,708 | $205,751 | $16,904 | $188,847 |
| 2022 | $1,708 | $205,751 | $16,904 | $188,847 |
| 2021 | $1,714 | $205,751 | $16,904 | $188,847 |
| 2020 | $1,455 | $166,935 | $16,904 | $150,031 |
| 2019 | $1,455 | $166,935 | $16,904 | $150,031 |
| 2018 | $1,402 | $166,935 | $16,904 | $150,031 |
| 2017 | $1,444 | $166,935 | $16,904 | $150,031 |
| 2016 | $1,381 | $166,935 | $16,904 | $150,031 |
| 2015 | $1,517 | $184,232 | $16,904 | $167,328 |
| 2014 | $1,517 | $184,232 | $16,904 | $167,328 |
Source: Public Records
Map
Nearby Homes
- 507 Poplar Springs Church Rd
- 711 Cedar Hill Dr
- 2305 Berwick Rd
- 734 Cedar Hill Dr
- 2612 W Dixon Blvd
- 000 Hubbard Terrace
- 1313 Dockery Dr Unit 1
- 1311 Dockery Dr
- 2720 W Dixon Blvd
- 1408 Lackey St
- 00 Charles Rd
- 114 Landon Ct
- 3024 Downing St Unit 18A
- 3024 Downing St Unit 19A
- 3121 Suffolk Dr
- 340 Beaver Dam Church Rd
- 697 Branton Dr
- 814 Rhodann Dr
- 0000 Polkville Rd
- 712 Maynard St
- 509 Old Boiling Springs Rd
- 2249 Albert Blanton Rd
- 510 Old Boiling Springs Rd
- 513 Old Boiling Springs Rd
- 508 Old Boiling Springs Rd
- 512 Old Boiling Springs Rd
- 2250 Albert Blanton Rd
- 2236 Albert Blanton Rd
- 515 Old Boiling Springs Rd
- 431 Old Boiling Springs Rd
- 429 Old Boiling Springs Rd
- 2230 Albert Blanton Rd
- 427 Old Boiling Springs Rd
- 2227 Albert Blanton Rd
- 425 Old Boiling Springs Rd
- 514 Old Boiling Springs Rd
- 2246 Albert Blanton Rd
- 422 Old Boiling Springs Rd
- 2221 Albert Blanton Rd
- 443 Poplar Springs Church Rd