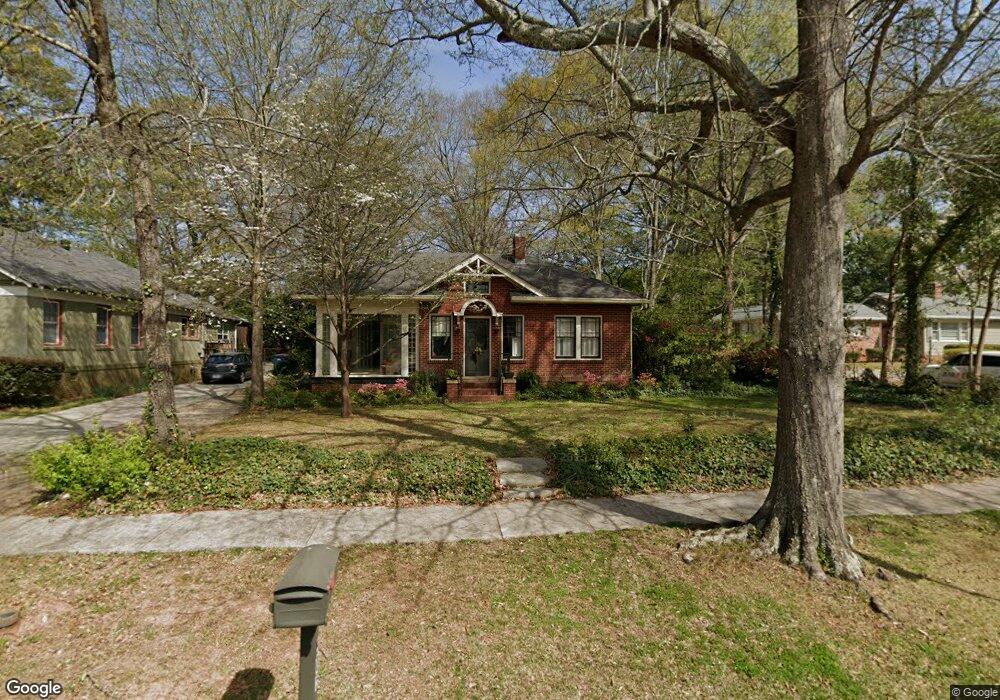
505 Park Ave Lagrange, GA 30240
Estimated Value: $170,000 - $289,000
2
Beds
1
Bath
1,723
Sq Ft
$136/Sq Ft
Est. Value
About This Home
This home is located at 505 Park Ave, Lagrange, GA 30240 and is currently estimated at $234,218, approximately $135 per square foot. 505 Park Ave is a home located in Troup County with nearby schools including Ethel W. Kight Elementary School, Hollis Hand Elementary School, and Franklin Forest Elementary School.
Ownership History
Date
Name
Owned For
Owner Type
Purchase Details
Closed on
Oct 28, 2019
Sold by
Adams C R
Bought by
Jennings Laura R
Current Estimated Value
Home Financials for this Owner
Home Financials are based on the most recent Mortgage that was taken out on this home.
Original Mortgage
$185,000
Outstanding Balance
$161,603
Interest Rate
3.6%
Estimated Equity
$72,615
Purchase Details
Closed on
Jan 25, 2019
Sold by
Adams Marie P
Bought by
Adams C R
Purchase Details
Closed on
Feb 1, 1984
Sold by
Fuller John Thomas Etal
Bought by
Adams Marie P
Purchase Details
Closed on
Aug 5, 1983
Sold by
Fuller John Thomas Etal
Bought by
Fuller John Thomas Etal
Purchase Details
Closed on
Jan 26, 1982
Sold by
Harrison Elizabeth H Fuller
Bought by
Fuller John Thomas Etal
Purchase Details
Closed on
Sep 10, 1964
Sold by
Harrison Olin
Bought by
Harrison Elizabeth H Fuller
Purchase Details
Closed on
Nov 1, 1945
Sold by
Fuller Raymond
Bought by
Harrison Olin
Create a Home Valuation Report for This Property
The Home Valuation Report is an in-depth analysis detailing your home's value as well as a comparison with similar homes in the area
Home Values in the Area
Average Home Value in this Area
Purchase History
| Date | Buyer | Sale Price | Title Company |
|---|---|---|---|
| Jennings Laura R | $185,000 | -- | |
| Adams C R | $57,000 | -- | |
| Adams Marie P | $46,500 | -- | |
| Fuller John Thomas Etal | -- | -- | |
| Fuller John Thomas Etal | -- | -- | |
| Harrison Elizabeth H Fuller | -- | -- | |
| Harrison Olin | -- | -- |
Source: Public Records
Mortgage History
| Date | Status | Borrower | Loan Amount |
|---|---|---|---|
| Open | Jennings Laura R | $185,000 |
Source: Public Records
Tax History Compared to Growth
Tax History
| Year | Tax Paid | Tax Assessment Tax Assessment Total Assessment is a certain percentage of the fair market value that is determined by local assessors to be the total taxable value of land and additions on the property. | Land | Improvement |
|---|---|---|---|---|
| 2024 | $2,049 | $75,124 | $10,000 | $65,124 |
| 2023 | $2,003 | $73,424 | $10,000 | $63,424 |
| 2022 | $1,934 | $69,304 | $10,000 | $59,304 |
| 2021 | $1,798 | $59,620 | $10,000 | $49,620 |
| 2020 | $1,798 | $59,620 | $10,000 | $49,620 |
| 2019 | $536 | $27,736 | $6,000 | $21,736 |
| 2018 | $536 | $27,736 | $6,000 | $21,736 |
| 2017 | $536 | $27,736 | $6,000 | $21,736 |
| 2016 | $526 | $27,405 | $6,000 | $21,405 |
| 2015 | $544 | $27,977 | $6,572 | $21,405 |
| 2014 | $510 | $26,850 | $6,572 | $20,278 |
| 2013 | -- | $27,648 | $6,540 | $21,108 |
Source: Public Records
Map
Nearby Homes
- 503 Park Ave
- 509 Park Ave
- 501 Park Ave
- 502 Park Ave Unit A
- 502 Park Ave Unit B
- 502 Park Ave
- 508 Boulevard
- 510 Park Ave
- 510 Boulevard
- 500 Park Ave
- 506 Boulevard
- 502 Boulevard
- 0 Ridge St Unit 7078926
- 0 Ridge St Unit 3152873
- 0 Ridge St Unit 3001452
- 0 Ridge St
- 512 Boulevard
- 423 Park Ave
- 512 Park Ave
- 515 Park Ave