Estimated Value: $103,000 - $197,000
2
Beds
1
Bath
807
Sq Ft
$169/Sq Ft
Est. Value
About This Home
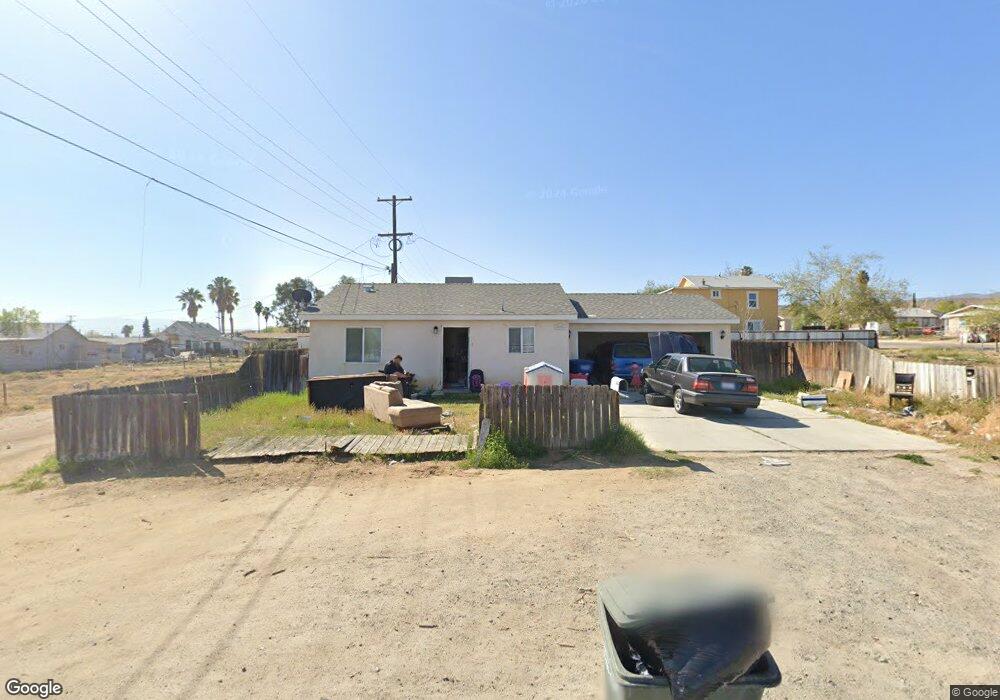
This home is located at 505 Pico St, Taft, CA 93268 and is currently estimated at $136,035, approximately $168 per square foot. 505 Pico St is a home located in Kern County with nearby schools including Conley Elementary School, Roosevelt Elementary School, and Lincoln Junior High School.
Ownership History
Date
Name
Owned For
Owner Type
Purchase Details
Closed on
Jul 2, 2010
Sold by
Singh Nand Vinesh and Singh Nand Rowena
Bought by
Singh Nand Vinesh and Singh Nand Rowena
Current Estimated Value
Purchase Details
Closed on
Feb 5, 2009
Sold by
Deutsche Bank National Trust Company
Bought by
Singh Nand Vinesh and Singh Nand Rowena
Purchase Details
Closed on
Sep 3, 2008
Sold by
Osornio Heriberto
Bought by
Deutsche Bank National Trust Co and Ffmlt Trust 2006-Ff13 Mortgage Pass Thro
Purchase Details
Closed on
Jun 12, 2006
Sold by
Singh Sawarn and Singh Sawan
Bought by
Osornio Heriberto
Home Financials for this Owner
Home Financials are based on the most recent Mortgage that was taken out on this home.
Original Mortgage
$142,400
Interest Rate
7.65%
Mortgage Type
Balloon
Purchase Details
Closed on
Sep 29, 2004
Sold by
Cal/Neva Investments Inc
Bought by
Singh Sawan
Create a Home Valuation Report for This Property
The Home Valuation Report is an in-depth analysis detailing your home's value as well as a comparison with similar homes in the area
Home Values in the Area
Average Home Value in this Area
Purchase History
We collect this data history from publicly available records. To have your information removed, we recommend requesting removal directly through your county’s website.
| Date | Buyer | Sale Price | Title Company |
|---|---|---|---|
| Singh Nand Vinesh | -- | None Available | |
| Singh Nand Vinesh | $37,000 | Fatcola | |
| Deutsche Bank National Trust Co | $93,598 | Accommodation | |
| Osornio Heriberto | $178,000 | None Available | |
| Singh Sawan | $7,500 | First American Title |
Source: Public Records
Mortgage History
We collect this data history from publicly available records. To have your information removed, we recommend requesting removal directly through your county’s website.
| Date | Status | Borrower | Loan Amount |
|---|---|---|---|
| Previous Owner | Osornio Heriberto | $142,400 |
Source: Public Records
Tax History
| Year | Tax Paid | Tax Assessment Tax Assessment Total Assessment is a certain percentage of the fair market value that is determined by local assessors to be the total taxable value of land and additions on the property. | Land | Improvement |
|---|---|---|---|---|
| 2025 | $1,300 | $47,309 | $19,307 | $28,002 |
| 2024 | $1,140 | $46,382 | $18,929 | $27,453 |
| 2023 | $1,140 | $45,473 | $18,558 | $26,915 |
| 2022 | $1,000 | $44,583 | $18,195 | $26,388 |
| 2021 | $929 | $43,710 | $17,839 | $25,871 |
| 2020 | $852 | $43,263 | $17,657 | $25,606 |
| 2019 | $825 | $43,263 | $17,657 | $25,606 |
| 2018 | $785 | $41,584 | $16,972 | $24,612 |
| 2017 | $766 | $40,770 | $16,640 | $24,130 |
| 2016 | $782 | $39,971 | $16,314 | $23,657 |
| 2015 | $738 | $39,371 | $16,069 | $23,302 |
| 2014 | $713 | $38,601 | $15,755 | $22,846 |
Source: Public Records
Map
Nearby Homes
Your Personal Tour Guide
Ask me questions while you tour the home.