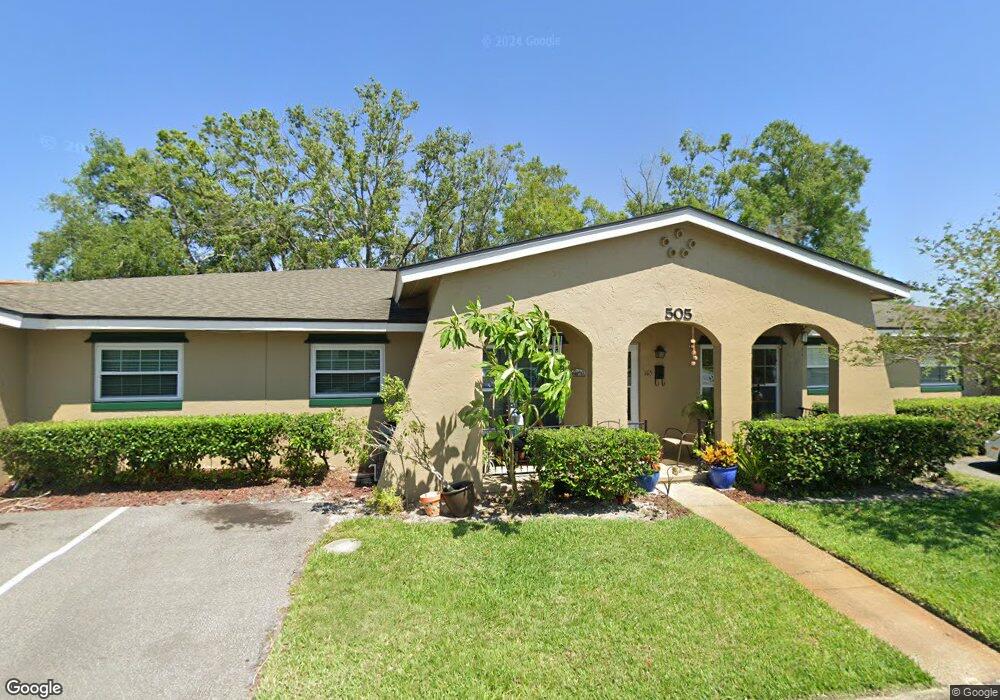
505 Polaris Loop Unit 109 Casselberry, FL 32707
Estimated Value: $163,811 - $186,000
2
Beds
1
Bath
987
Sq Ft
$179/Sq Ft
Est. Value
About This Home
This home is located at 505 Polaris Loop Unit 109, Casselberry, FL 32707 and is currently estimated at $176,203, approximately $178 per square foot. 505 Polaris Loop Unit 109 is a home located in Seminole County with nearby schools including English Estates Elementary School, South Seminole Academy, and Lake Howell High School.
Ownership History
Date
Name
Owned For
Owner Type
Purchase Details
Closed on
Jun 30, 2003
Sold by
Engei Kathleen
Bought by
Rodriguez Ericburt
Current Estimated Value
Home Financials for this Owner
Home Financials are based on the most recent Mortgage that was taken out on this home.
Original Mortgage
$66,900
Outstanding Balance
$28,314
Interest Rate
5.2%
Mortgage Type
Unknown
Estimated Equity
$147,889
Purchase Details
Closed on
Oct 10, 2001
Sold by
David Nolan and David Ginger
Bought by
Engel Kathleen
Home Financials for this Owner
Home Financials are based on the most recent Mortgage that was taken out on this home.
Original Mortgage
$46,000
Interest Rate
6.87%
Purchase Details
Closed on
Jul 1, 2001
Bought by
Rodriguez Ericburt
Purchase Details
Closed on
Jan 1, 1993
Bought by
Rodriguez Ericburt
Purchase Details
Closed on
Feb 1, 1985
Bought by
Rodriguez Ericburt
Create a Home Valuation Report for This Property
The Home Valuation Report is an in-depth analysis detailing your home's value as well as a comparison with similar homes in the area
Home Values in the Area
Average Home Value in this Area
Purchase History
| Date | Buyer | Sale Price | Title Company |
|---|---|---|---|
| Rodriguez Ericburt | $69,000 | Gulf Coast Title & Closings | |
| Engel Kathleen | $46,000 | -- | |
| Rodriguez Ericburt | $46,000 | -- | |
| Rodriguez Ericburt | $38,000 | -- | |
| Rodriguez Ericburt | $45,900 | -- |
Source: Public Records
Mortgage History
| Date | Status | Borrower | Loan Amount |
|---|---|---|---|
| Open | Rodriguez Ericburt | $66,900 | |
| Previous Owner | Engel Kathleen | $46,000 |
Source: Public Records
Tax History Compared to Growth
Tax History
| Year | Tax Paid | Tax Assessment Tax Assessment Total Assessment is a certain percentage of the fair market value that is determined by local assessors to be the total taxable value of land and additions on the property. | Land | Improvement |
|---|---|---|---|---|
| 2024 | $336 | $45,151 | -- | -- |
| 2023 | $317 | $43,836 | $0 | $0 |
| 2021 | $276 | $41,319 | $0 | $0 |
| 2020 | $265 | $40,749 | $0 | $0 |
| 2019 | $253 | $39,833 | $0 | $0 |
| 2018 | $243 | $39,090 | $0 | $0 |
| 2017 | $234 | $38,286 | $0 | $0 |
| 2016 | $227 | $37,761 | $0 | $0 |
| 2015 | $221 | $37,238 | $0 | $0 |
| 2014 | $221 | $36,942 | $0 | $0 |
Source: Public Records
Map
Nearby Homes
- 505 Polaris Loop Unit 107
- 2541 Derbyshire Cir
- 527 Etna Ct Unit 103
- 211 Esplanade Way Unit 105
- 200 Georgetown Dr Unit C
- 207 Esplanade Way Unit 101
- 117 Georgetown Dr Unit C
- 526 Etna Ct Unit 108
- 228 Everest Point Unit 108
- 208 Diamond Cove Unit 104
- 110 Todd Dr
- 633 Desoto Dr Unit 8A
- 2205 Winslow Cir
- 1221 Thunder Trail Unit 1
- 1163 Paseo Del Mar Unit C
- 1163 Paseo Del Mar Unit B
- 1175 Paseo Del Mar Unit A
- 1150 Carmel Cir Unit 201
- 1135 Thunder Trail
- 2236 Winslow Cir
- 505 Polaris Loop Unit 111
- 505 Polaris Loop Unit 105
- 505 Polaris Loop Unit 101
- 505 Polaris Loop Unit 103
- 507 Polaris Loop Unit 111
- 507 Polaris Loop Unit 105
- 507 Polaris Loop Unit 109
- 507 Polaris Loop Unit 103
- 507 Polaris Loop Unit 107
- 507 Polaris Loop Unit 101
- 503 Polaris Loop Unit 503
- 503 Polaris Loop Unit 109
- 503 Polaris Loop Unit 103
- 503 Polaris Loop Unit 101
- 503 Polaris Loop Unit 107
- 503 Polaris Loop Unit 111
- 509 Polaris Loop Unit 105
- 509 Polaris Loop Unit 111
- 509 Polaris Loop Unit 101