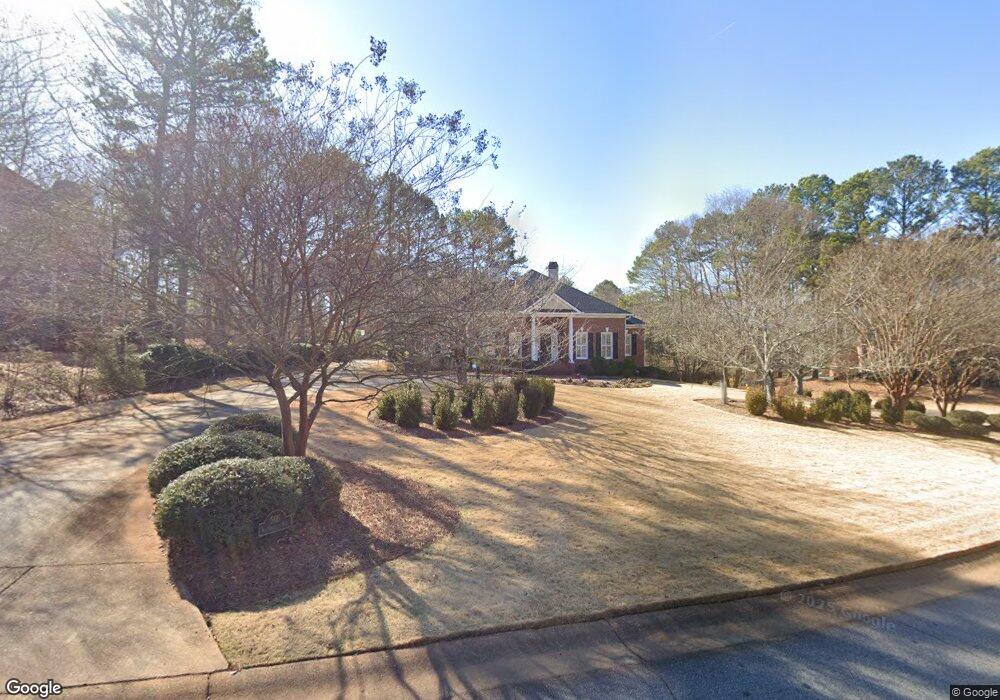
505 River Bottom Rd Athens, GA 30606
Estimated Value: $590,596 - $643,000
3
Beds
3
Baths
3,444
Sq Ft
$178/Sq Ft
Est. Value
About This Home
This home is located at 505 River Bottom Rd, Athens, GA 30606 and is currently estimated at $611,649, approximately $177 per square foot. 505 River Bottom Rd is a home located in Clarke County with nearby schools including Timothy Elementary School, Clarke Middle School, and Clarke Central High School.
Ownership History
Date
Name
Owned For
Owner Type
Purchase Details
Closed on
Oct 12, 2010
Sold by
Sansing Anne A
Bought by
Thornburg Frank B
Current Estimated Value
Home Financials for this Owner
Home Financials are based on the most recent Mortgage that was taken out on this home.
Original Mortgage
$350,000
Outstanding Balance
$229,386
Interest Rate
4.37%
Mortgage Type
VA
Estimated Equity
$382,264
Purchase Details
Closed on
Apr 11, 2000
Sold by
Sansing Norman G and Sans Anne A
Bought by
Sansing Anne A
Purchase Details
Closed on
Mar 27, 1998
Sold by
Harllee Robert L and Harllee Nancy L
Bought by
Sansing Norman G and Sansing Anne A
Purchase Details
Closed on
Mar 3, 1993
Sold by
Coggins Land Company
Bought by
Harllee Robert L and Harllee Nancy L
Purchase Details
Closed on
Nov 20, 1992
Sold by
C H C Development Co
Bought by
Coggins Land Company
Create a Home Valuation Report for This Property
The Home Valuation Report is an in-depth analysis detailing your home's value as well as a comparison with similar homes in the area
Home Values in the Area
Average Home Value in this Area
Purchase History
| Date | Buyer | Sale Price | Title Company |
|---|---|---|---|
| Thornburg Frank B | $350,000 | -- | |
| Sansing Anne A | -- | -- | |
| Sansing Norman G | $31,500 | -- | |
| Harllee Robert L | $30,300 | -- | |
| Coggins Land Company | -- | -- |
Source: Public Records
Mortgage History
| Date | Status | Borrower | Loan Amount |
|---|---|---|---|
| Open | Thornburg Frank B | $350,000 |
Source: Public Records
Tax History Compared to Growth
Tax History
| Year | Tax Paid | Tax Assessment Tax Assessment Total Assessment is a certain percentage of the fair market value that is determined by local assessors to be the total taxable value of land and additions on the property. | Land | Improvement |
|---|---|---|---|---|
| 2025 | $4,846 | $253,278 | $26,000 | $227,278 |
| 2024 | $4,846 | $229,970 | $26,000 | $203,970 |
| 2023 | $4,887 | $213,667 | $26,000 | $187,667 |
| 2022 | $4,496 | $174,968 | $26,000 | $148,968 |
| 2021 | $4,489 | $156,317 | $26,000 | $130,317 |
| 2020 | $4,334 | $145,882 | $26,000 | $119,882 |
| 2019 | $4,240 | $136,702 | $26,000 | $110,702 |
| 2018 | $4,258 | $137,986 | $24,000 | $113,986 |
| 2017 | $4,198 | $133,638 | $24,000 | $109,638 |
| 2016 | $4,023 | $128,487 | $24,000 | $104,487 |
| 2015 | $4,044 | $128,930 | $24,000 | $104,930 |
| 2014 | $4,014 | $127,852 | $24,000 | $103,852 |
Source: Public Records
Map
Nearby Homes
- 450 River Bottom Rd
- 115 Woodhaven St
- 184 Hillsborough Dr
- 256 Cherokee Ridge
- 164 Lucy Ln
- 860 Mitchell Bridge Rd Unit 8
- 860 Mitchell Bridge Rd Unit 8
- 575 Vaughn Rd
- 134 Bent Tree Dr
- 212 Huntington Shoals Dr
- 532 Huntington Rd Unit 7
- 141 Huntington Shoals Dr
- 125 Mitchell Bluff
- 150 The Preserve Dr Unit H2
- 470 Huntington Rd Unit 5
- 124 Pin Oak Ct
- 637 Huntington Rd Unit B1
- 240 W Huntington Rd
- 0 River Bottom Way
- 495 River Bottom Rd
- 102 River Bottom Way
- 111 River Bottom Way
- 485 River Bottom Rd
- 500 River Bottom Rd
- 510 River Bottom Rd
- 112 River Bottom Way
- 475 River Bottom Rd
- 490 River Bottom Rd
- 122 River Bottom Way
- 525 River Bottom Rd
- 530 River Bottom Rd
- 480 River Bottom Rd
- 455 River Bottom Rd
- 114 River Bottom Terrace
- 465 Providence Rd
- 115 River Bottom Place
- 425 River Bottom Rd
- 435 River Bottom Rd