Estimated Value: $313,000 - $353,000
3
Beds
2
Baths
1,595
Sq Ft
$208/Sq Ft
Est. Value
About This Home
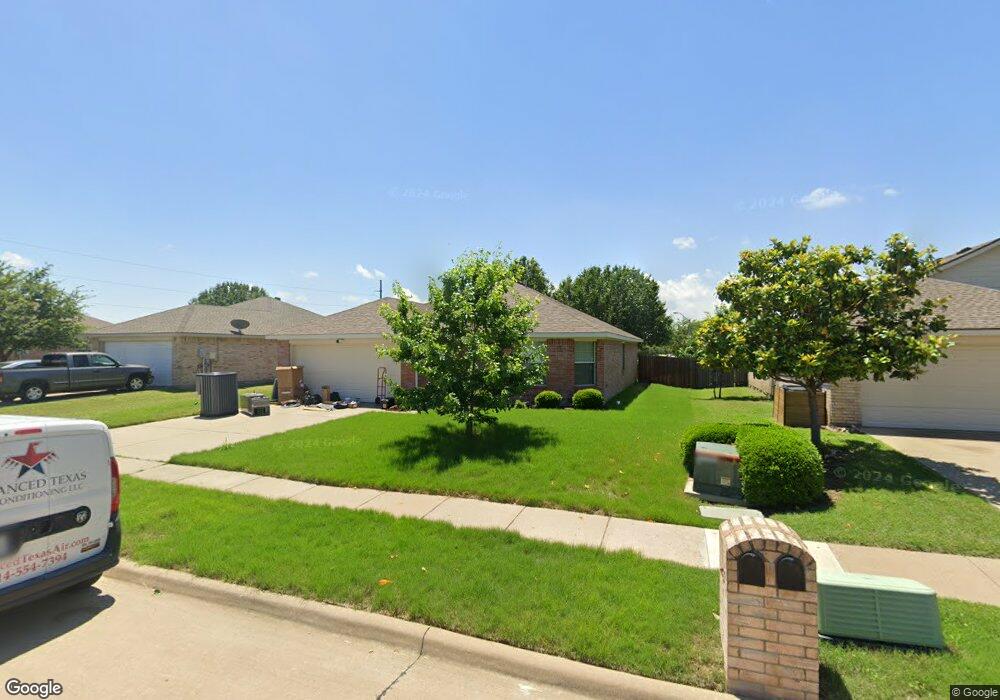
This home is located at 505 Robinwood Dr, Wylie, TX 75098 and is currently estimated at $331,725, approximately $207 per square foot. 505 Robinwood Dr is a home located in Collin County with nearby schools including T.F. Birmingham Elementary School, Frank Mcmillan Junior High School, and Davis Intermediate School.
Ownership History
Date
Name
Owned For
Owner Type
Purchase Details
Closed on
Feb 6, 2020
Sold by
Stewart Aletha and Gill Paul
Bought by
Burger Troy W and Stowe Maegan L
Current Estimated Value
Home Financials for this Owner
Home Financials are based on the most recent Mortgage that was taken out on this home.
Original Mortgage
$213,000
Outstanding Balance
$189,096
Interest Rate
3.74%
Mortgage Type
New Conventional
Estimated Equity
$142,629
Purchase Details
Closed on
Jun 2, 2005
Sold by
Stewart Aletha A
Bought by
Stewart Aletha A
Purchase Details
Closed on
Apr 7, 2004
Sold by
Rh Of Texas Lp
Bought by
Stewart Aletha
Home Financials for this Owner
Home Financials are based on the most recent Mortgage that was taken out on this home.
Original Mortgage
$69,950
Interest Rate
5.38%
Mortgage Type
Purchase Money Mortgage
Create a Home Valuation Report for This Property
The Home Valuation Report is an in-depth analysis detailing your home's value as well as a comparison with similar homes in the area
Home Values in the Area
Average Home Value in this Area
Purchase History
| Date | Buyer | Sale Price | Title Company |
|---|---|---|---|
| Burger Troy W | -- | Independence Title Company | |
| Stewart Aletha A | -- | -- | |
| Stewart Aletha | -- | -- |
Source: Public Records
Mortgage History
| Date | Status | Borrower | Loan Amount |
|---|---|---|---|
| Open | Burger Troy W | $213,000 | |
| Previous Owner | Stewart Aletha | $69,950 |
Source: Public Records
Tax History Compared to Growth
Tax History
| Year | Tax Paid | Tax Assessment Tax Assessment Total Assessment is a certain percentage of the fair market value that is determined by local assessors to be the total taxable value of land and additions on the property. | Land | Improvement |
|---|---|---|---|---|
| 2025 | $4,994 | $328,832 | $95,000 | $233,832 |
| 2024 | $4,994 | $318,028 | $95,000 | $230,671 |
| 2023 | $4,994 | $289,116 | $85,000 | $241,051 |
| 2022 | $5,766 | $262,833 | $85,000 | $221,436 |
| 2021 | $5,622 | $238,939 | $65,000 | $173,939 |
| 2020 | $5,588 | $225,034 | $55,000 | $170,034 |
| 2019 | $5,687 | $216,398 | $55,000 | $169,010 |
| 2018 | $5,298 | $196,725 | $55,000 | $157,296 |
| 2017 | $4,816 | $193,840 | $50,000 | $143,840 |
| 2016 | $4,517 | $169,081 | $40,000 | $129,081 |
| 2015 | $2,665 | $150,110 | $35,000 | $115,110 |
Source: Public Records
Map
Nearby Homes
- 410 Oxford Dr
- 907 Carlton Rd
- 902 Greene Way
- 913 Chickesaw Ln
- 908 Greene Way
- 705 Baldwin Rd
- 1003 Ann Dr
- 626 Gunters Mountain Ln
- 605 Graham Ct
- 713 Kinston Ct
- 517 E Gaston Dr
- Crest Plan at The Apollo
- Nova Plan at The Apollo
- Solis Plan at The Apollo
- 1422 Mars Lander Ln
- 1426 Mars Lander Ln
- 115 Pullman Place
- 1430 Mars Lander Ln
- 1432 Mars Lander Ln
- 423 N Winding Oaks Dr
- 503 Robinwood Dr
- 507 Robinwood Dr
- 509 Robinwood Dr
- 501 Robinwood Dr
- 506 Robinwood Rd
- 504 Robinwood Dr
- 506 Robinwood Dr
- 508 Robinwood Dr
- 511 Robinwood Dr
- 715 Overton Dr
- 713 Overton Dr
- 510 Robinwood Dr
- 801 Chickesaw Ln
- 503 Brighton Ct
- 501 Brighton Ct
- 800 Chickesaw Ln
- 512 Robinwood Dr
- 505 Brighton Ct
- 709 Overton Dr
- 513 Robinwood Dr