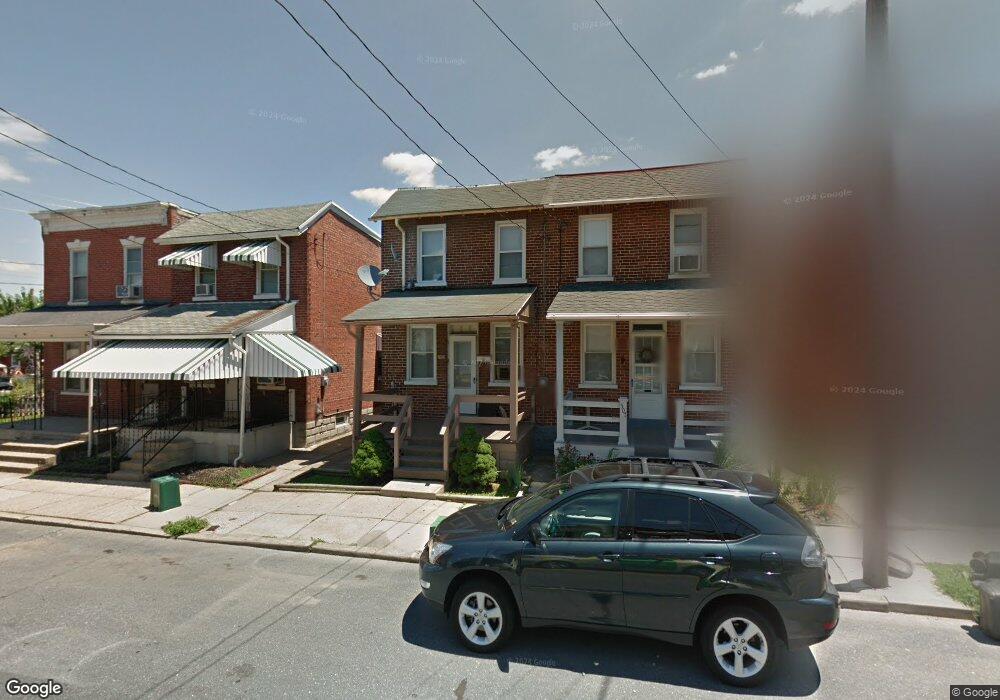
505 Ruby St Lancaster, PA 17603
West End NeighborhoodEstimated Value: $169,000 - $213,000
3
Beds
1
Bath
1,088
Sq Ft
$178/Sq Ft
Est. Value
About This Home
This home is located at 505 Ruby St, Lancaster, PA 17603 and is currently estimated at $193,729, approximately $178 per square foot. 505 Ruby St is a home located in Lancaster County with nearby schools including Smith-Wade-El Elementary School, Wheatland Middle School, and McCaskey High School.
Ownership History
Date
Name
Owned For
Owner Type
Purchase Details
Closed on
Jan 20, 2023
Sold by
Rodriguez Brian E and Rodriguez Luz M
Bought by
Villarraga Luz M
Current Estimated Value
Purchase Details
Closed on
Dec 1, 2000
Sold by
Lutz Kenneth L and Lutz Lydia M
Bought by
Rodriguez Brian E and Villarraga Luz M
Home Financials for this Owner
Home Financials are based on the most recent Mortgage that was taken out on this home.
Original Mortgage
$58,710
Interest Rate
7.76%
Purchase Details
Closed on
Dec 10, 1999
Sold by
C H Residential Properties Llc
Bought by
Lutz Kenneth L and Lutz Lydia M
Purchase Details
Closed on
Sep 3, 1999
Sold by
Mcgallicher Terry L and Mcgallicher Mary Ann H
Bought by
Allfirst Bank and The York Bank & Trust Company
Create a Home Valuation Report for This Property
The Home Valuation Report is an in-depth analysis detailing your home's value as well as a comparison with similar homes in the area
Home Values in the Area
Average Home Value in this Area
Purchase History
| Date | Buyer | Sale Price | Title Company |
|---|---|---|---|
| Villarraga Luz M | -- | -- | |
| Rodriguez Brian E | $61,800 | -- | |
| Lutz Kenneth L | $37,000 | -- | |
| Allfirst Bank | -- | -- |
Source: Public Records
Mortgage History
| Date | Status | Borrower | Loan Amount |
|---|---|---|---|
| Previous Owner | Rodriguez Brian E | $58,710 |
Source: Public Records
Tax History
| Year | Tax Paid | Tax Assessment Tax Assessment Total Assessment is a certain percentage of the fair market value that is determined by local assessors to be the total taxable value of land and additions on the property. | Land | Improvement |
|---|---|---|---|---|
| 2025 | $3,344 | $84,500 | $20,400 | $64,100 |
| 2024 | $3,344 | $84,500 | $20,400 | $64,100 |
| 2023 | $3,287 | $84,500 | $20,400 | $64,100 |
| 2022 | $3,151 | $84,500 | $20,400 | $64,100 |
| 2021 | $3,083 | $84,500 | $20,400 | $64,100 |
| 2020 | $3,083 | $84,500 | $20,400 | $64,100 |
| 2019 | $3,037 | $84,500 | $20,400 | $64,100 |
| 2018 | $1,365 | $84,500 | $20,400 | $64,100 |
| 2017 | $2,898 | $63,100 | $14,200 | $48,900 |
| 2016 | $2,872 | $63,100 | $14,200 | $48,900 |
| 2015 | $1,120 | $63,100 | $14,200 | $48,900 |
| 2014 | $2,079 | $63,100 | $14,200 | $48,900 |
Source: Public Records
Map
Nearby Homes
Your Personal Tour Guide
Ask me questions while you tour the home.