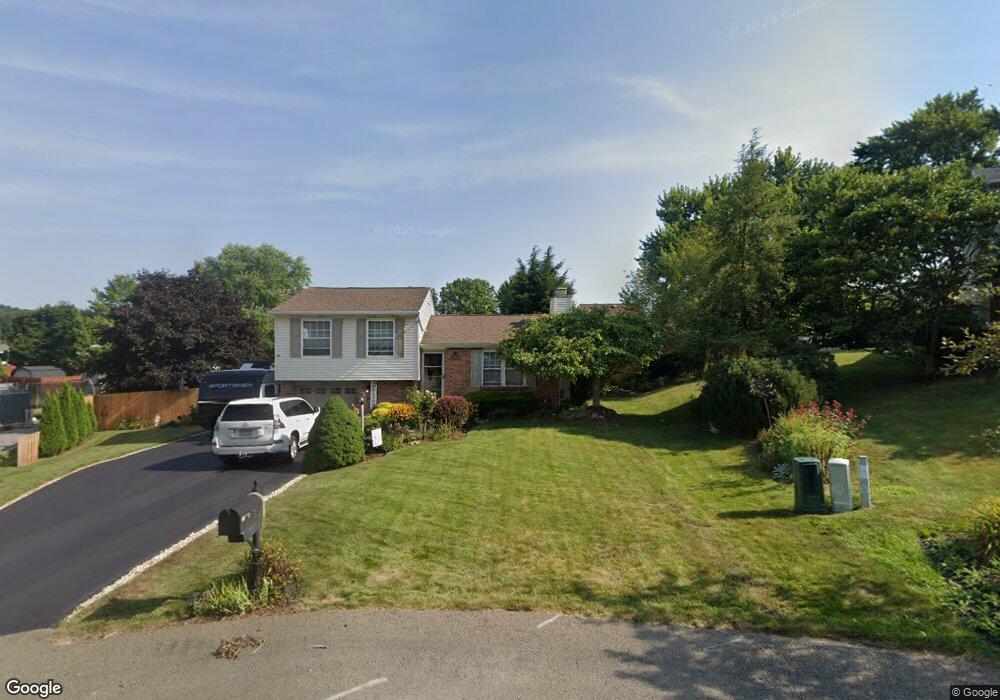
505 Rywood Ct Cranberry Township, PA 16066
Estimated Value: $190,299 - $395,000
3
Beds
2
Baths
1,418
Sq Ft
$229/Sq Ft
Est. Value
About This Home
This home is located at 505 Rywood Ct, Cranberry Township, PA 16066 and is currently estimated at $324,325, approximately $228 per square foot. 505 Rywood Ct is a home located in Butler County with nearby schools including Haine Middle School, Haine Elementary School, and Ryan Gloyer Middle School.
Ownership History
Date
Name
Owned For
Owner Type
Purchase Details
Closed on
Jan 10, 2017
Sold by
Wolff John J and Wolff Sharon E
Bought by
Wolfee Dineen M
Current Estimated Value
Home Financials for this Owner
Home Financials are based on the most recent Mortgage that was taken out on this home.
Original Mortgage
$70,900
Outstanding Balance
$58,759
Interest Rate
4.32%
Mortgage Type
Stand Alone Second
Estimated Equity
$265,566
Purchase Details
Closed on
Sep 24, 2009
Sold by
Whitney Joseph M
Bought by
Wolff John J
Home Financials for this Owner
Home Financials are based on the most recent Mortgage that was taken out on this home.
Original Mortgage
$128,000
Interest Rate
5.31%
Mortgage Type
New Conventional
Purchase Details
Closed on
Jul 29, 2004
Sold by
Rossi Melissa
Bought by
Whitney Joseph and Bernesser,Mandi
Home Financials for this Owner
Home Financials are based on the most recent Mortgage that was taken out on this home.
Original Mortgage
$173,000
Interest Rate
6.2%
Mortgage Type
New Conventional
Create a Home Valuation Report for This Property
The Home Valuation Report is an in-depth analysis detailing your home's value as well as a comparison with similar homes in the area
Home Values in the Area
Average Home Value in this Area
Purchase History
| Date | Buyer | Sale Price | Title Company |
|---|---|---|---|
| Wolfee Dineen M | $89,300 | None Available | |
| Wolff John J | $183,000 | -- | |
| Whitney Joseph | $173,000 | -- |
Source: Public Records
Mortgage History
| Date | Status | Borrower | Loan Amount |
|---|---|---|---|
| Open | Wolfee Dineen M | $70,900 | |
| Previous Owner | Wolff John J | $128,000 | |
| Previous Owner | Whitney Joseph | $173,000 |
Source: Public Records
Tax History Compared to Growth
Tax History
| Year | Tax Paid | Tax Assessment Tax Assessment Total Assessment is a certain percentage of the fair market value that is determined by local assessors to be the total taxable value of land and additions on the property. | Land | Improvement |
|---|---|---|---|---|
| 2025 | $3,588 | $20,020 | $1,140 | $18,880 |
| 2024 | $3,481 | $20,020 | $1,140 | $18,880 |
| 2023 | $3,430 | $20,020 | $1,140 | $18,880 |
| 2022 | $3,430 | $20,020 | $1,140 | $18,880 |
| 2021 | $3,379 | $20,020 | $0 | $0 |
| 2020 | $3,379 | $20,020 | $1,140 | $18,880 |
| 2019 | $3,341 | $20,020 | $1,140 | $18,880 |
| 2018 | $3,341 | $20,020 | $1,140 | $18,880 |
| 2017 | $3,281 | $20,020 | $1,140 | $18,880 |
| 2016 | $900 | $20,020 | $1,140 | $18,880 |
| 2015 | $406 | $20,020 | $1,140 | $18,880 |
| 2014 | $406 | $20,020 | $1,140 | $18,880 |
Source: Public Records
Map
Nearby Homes
- 109 Briarwood Ln
- 115 Leatherbark Rd
- 937 Lynwood Ct
- 116 Antler Hollow Ct
- 26 Holiday Dr
- 1573 Haine School Rd
- 209 North Ct
- 210 Wyndmere Dr
- 113 Mews Ln
- 605 Bristol Place
- 585 Brandywine Dr
- 401 Sunny Dale Dr
- 803 Trowbridge Place
- 300 Trafalgar Square
- 210 Sandalwood Dr
- 404 Plum Ct
- Mendelssohn w/ Finished Basement Plan at Breckenridge
- Serenade w/ Finished Basement Plan at Breckenridge
- Schubert w/ Finished Basement Plan at Breckenridge
- 202 Hounslow Rd
- 506 Rywood Ct
- 402 Leatherbark Rd
- 404 Leatherbark Rd
- 316 Leatherbark Rd
- 207 Briarwood Ln
- 406 Leatherbark Rd
- 504 Rywood Ct
- 502 Rywood Ct
- 314 Leatherbark Rd
- 307 Spruce Ln
- 205 Cypress Ln
- 214 Cypress Ln
- 708 Ivy Ln
- 408 Leatherbark Rd
- 107 Fox Chase Ct
- 109 Fox Chase Ct
- 105 Fox Chase Ct
- 312 Leatherbark Rd
- 211 Briarwood Ln
- 203 Briarwood Ln