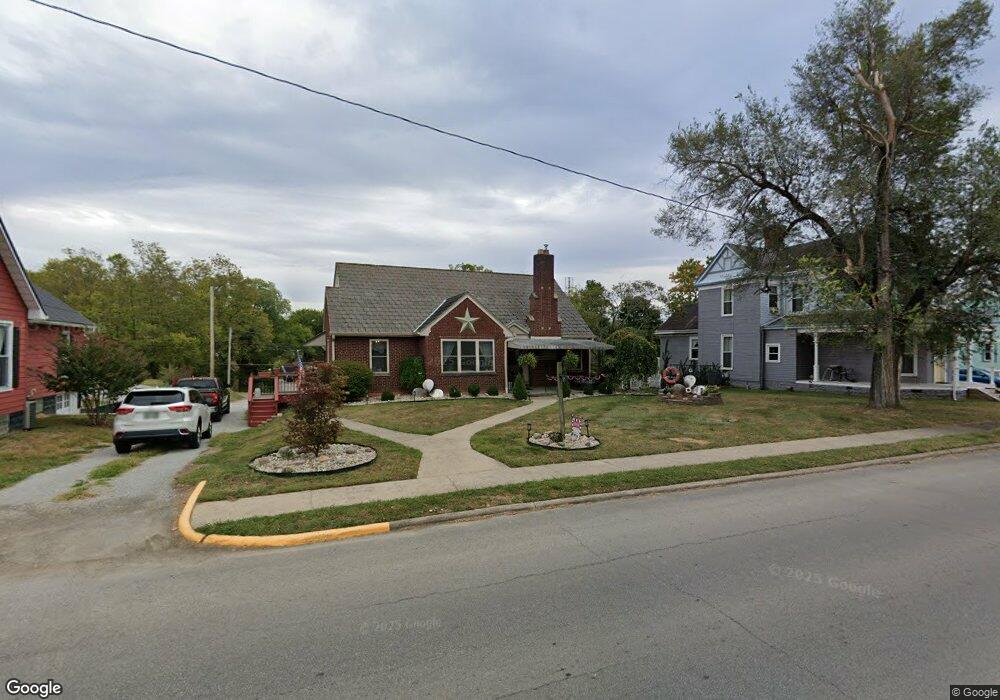
505 S Main St Georgetown, OH 45121
Estimated Value: $203,000 - $215,508
3
Beds
2
Baths
1,260
Sq Ft
$164/Sq Ft
Est. Value
About This Home
This home is located at 505 S Main St, Georgetown, OH 45121 and is currently estimated at $207,127, approximately $164 per square foot. 505 S Main St is a home located in Brown County with nearby schools including Georgetown Elementary School and Georgetown Jr/Sr High School.
Ownership History
Date
Name
Owned For
Owner Type
Purchase Details
Closed on
May 22, 1998
Sold by
Purdin Betty J
Bought by
Germann George and Germann Carla
Current Estimated Value
Home Financials for this Owner
Home Financials are based on the most recent Mortgage that was taken out on this home.
Original Mortgage
$78,000
Outstanding Balance
$15,360
Interest Rate
7.19%
Mortgage Type
New Conventional
Estimated Equity
$191,767
Purchase Details
Closed on
May 1, 1995
Sold by
Purdin Betty J
Bought by
George and Germann Carla
Create a Home Valuation Report for This Property
The Home Valuation Report is an in-depth analysis detailing your home's value as well as a comparison with similar homes in the area
Home Values in the Area
Average Home Value in this Area
Purchase History
| Date | Buyer | Sale Price | Title Company |
|---|---|---|---|
| Germann George | $80,000 | -- | |
| George | $80,000 | -- |
Source: Public Records
Mortgage History
| Date | Status | Borrower | Loan Amount |
|---|---|---|---|
| Open | Germann George | $78,000 | |
| Closed | George | $0 |
Source: Public Records
Tax History
| Year | Tax Paid | Tax Assessment Tax Assessment Total Assessment is a certain percentage of the fair market value that is determined by local assessors to be the total taxable value of land and additions on the property. | Land | Improvement |
|---|---|---|---|---|
| 2024 | $2,028 | $57,270 | $5,450 | $51,820 |
| 2023 | $2,029 | $42,020 | $4,530 | $37,490 |
| 2022 | $1,620 | $42,020 | $4,530 | $37,490 |
| 2021 | $1,606 | $42,020 | $4,530 | $37,490 |
| 2020 | $1,421 | $35,030 | $3,790 | $31,240 |
| 2019 | $1,411 | $35,030 | $3,790 | $31,240 |
| 2018 | $1,401 | $35,030 | $3,790 | $31,240 |
| 2017 | $984 | $29,200 | $4,170 | $25,030 |
| 2016 | $984 | $29,200 | $4,170 | $25,030 |
| 2015 | $1,025 | $29,200 | $4,170 | $25,030 |
| 2014 | $1,025 | $28,820 | $3,790 | $25,030 |
| 2013 | $1,022 | $28,820 | $3,790 | $25,030 |
Source: Public Records
Map
Nearby Homes
- 505 S Water St
- 405 N Main St
- 406 E North St
- 399 Elmwood Ct
- 401 Elmwood Ct
- 60 New St
- 155 Free Soil Rd
- 666 E State St
- 508 Mount Orab Pike
- 708 E State St
- 25 Douglas Ln
- 20 Douglas Cir
- 0 St Rt 221 & Footbridge Unit 1826509
- 175 Douglas Cir
- 427 Kenwood Ave
- 20 Lakeview Acres Dr
- 1 N Kenwood Ave
- 2 N Kenwood Ave
- 470 Free Soil Rd
- 7029 Free Soil Rd