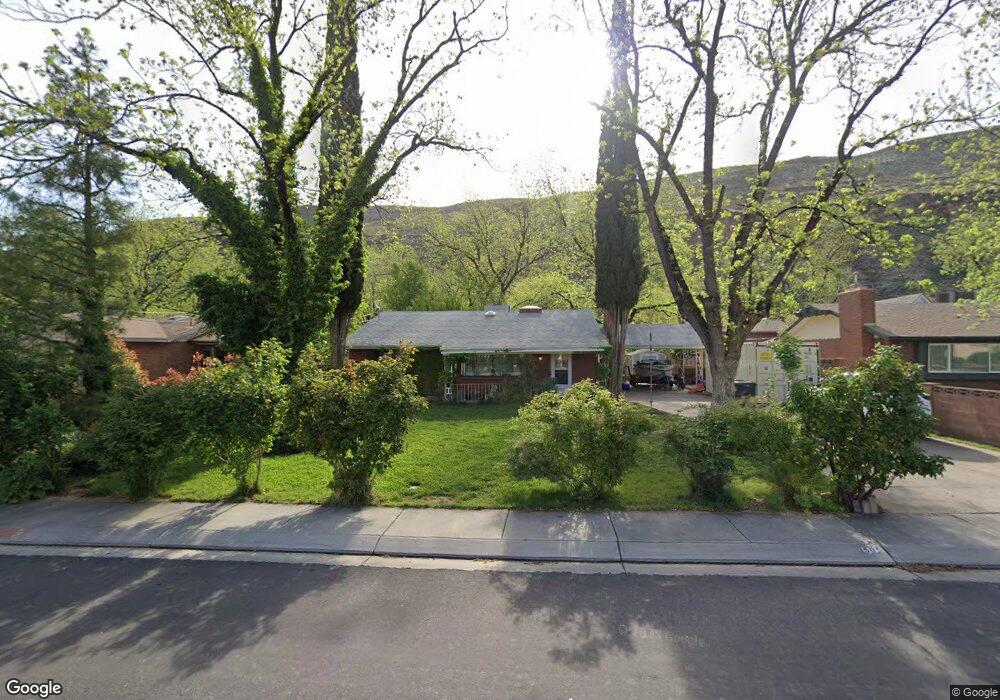
505 S Main St Unit 1 Hurricane, UT 84737
Estimated Value: $394,888 - $421,000
3
Beds
2
Baths
1,613
Sq Ft
$253/Sq Ft
Est. Value
About This Home
This home is located at 505 S Main St Unit 1, Hurricane, UT 84737 and is currently estimated at $407,944, approximately $252 per square foot. 505 S Main St Unit 1 is a home located in Washington County with nearby schools including Hurricane High School, Hurricane Middle School, and Three Falls School.
Ownership History
Date
Name
Owned For
Owner Type
Purchase Details
Closed on
Dec 7, 2012
Sold by
Fahrenkamp John
Bought by
Fahrenkamp John and Fahrenkamp Jordan
Current Estimated Value
Purchase Details
Closed on
Sep 11, 2009
Sold by
Johnson Jeffery A and Johnson Lenzi
Bought by
Fahrenkamp John
Purchase Details
Closed on
Apr 29, 2008
Sold by
Johnson Jeffery A
Bought by
Johnson Jeffery A and Johnson Lenzi
Home Financials for this Owner
Home Financials are based on the most recent Mortgage that was taken out on this home.
Original Mortgage
$187,064
Interest Rate
5.81%
Mortgage Type
FHA
Purchase Details
Closed on
Jan 4, 2005
Sold by
Anderson David and Anderson Virginia
Bought by
Tracy Richard T and Tracy Mary E
Home Financials for this Owner
Home Financials are based on the most recent Mortgage that was taken out on this home.
Original Mortgage
$101,600
Interest Rate
5.69%
Mortgage Type
New Conventional
Create a Home Valuation Report for This Property
The Home Valuation Report is an in-depth analysis detailing your home's value as well as a comparison with similar homes in the area
Home Values in the Area
Average Home Value in this Area
Purchase History
| Date | Buyer | Sale Price | Title Company |
|---|---|---|---|
| Fahrenkamp John | -- | Sounthern Utah Title | |
| Fahrenkamp John | -- | Southern Utah Title | |
| Johnson Jeffery A | -- | Southern Utah Title Co | |
| Johnson Jeffery A | -- | Southern Utah Title Co | |
| Tracy Richard T | -- | Terra Title Co |
Source: Public Records
Mortgage History
| Date | Status | Borrower | Loan Amount |
|---|---|---|---|
| Previous Owner | Johnson Jeffery A | $187,064 | |
| Previous Owner | Tracy Richard T | $101,600 |
Source: Public Records
Tax History Compared to Growth
Tax History
| Year | Tax Paid | Tax Assessment Tax Assessment Total Assessment is a certain percentage of the fair market value that is determined by local assessors to be the total taxable value of land and additions on the property. | Land | Improvement |
|---|---|---|---|---|
| 2025 | $1,530 | $208,065 | $63,250 | $144,815 |
| 2023 | $1,502 | $201,520 | $52,250 | $149,270 |
| 2022 | $1,586 | $199,430 | $52,250 | $147,180 |
| 2021 | $1,446 | $268,700 | $65,000 | $203,700 |
| 2020 | $1,311 | $227,700 | $65,000 | $162,700 |
| 2019 | $1,252 | $211,000 | $55,000 | $156,000 |
| 2018 | $1,222 | $101,915 | $0 | $0 |
| 2017 | $1,142 | $95,205 | $0 | $0 |
| 2016 | $1,013 | $81,840 | $0 | $0 |
| 2015 | $1,022 | $79,475 | $0 | $0 |
| 2014 | $964 | $77,990 | $0 | $0 |
Source: Public Records
Map
Nearby Homes
- 231 Main St
- 237 S 100 W
- 389 S 300 W
- 361 S 300 W
- 155 S 100 E
- 297 W 200 S
- 115 S 100 E
- 0 Home of the Hurricane H Unit 24-247435
- 577 W 400 S
- 589 W 375 S
- 591 W 300 S
- 1191 S 100 W
- 175 N 160 E
- 481 W 100 N
- 717 S 775 W
- 246 N 200 W
- 265 N State St Unit 4,5,6, House
- 0 Null Unit 25-267456
- 0 Null Unit 21-221464
- 0 Null Unit 22-235602