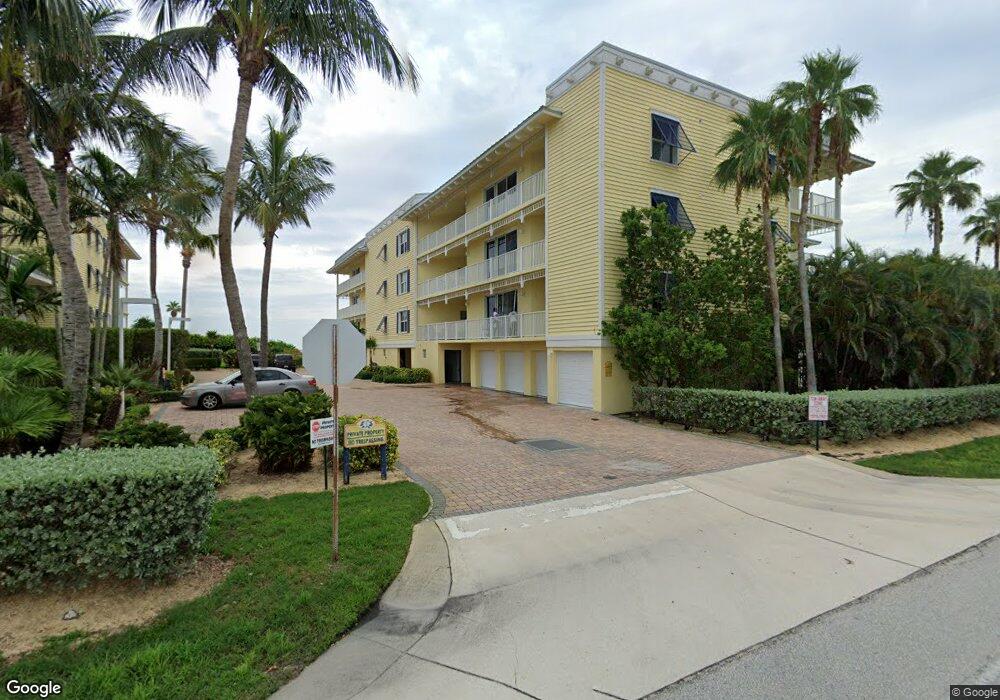
505 S Miramar Ave Unit 2202 Indialantic, FL 32903
Estimated Value: $1,047,000 - $1,105,000
3
Beds
3
Baths
2,682
Sq Ft
$400/Sq Ft
Est. Value
About This Home
This home is located at 505 S Miramar Ave Unit 2202, Indialantic, FL 32903 and is currently estimated at $1,072,886, approximately $400 per square foot. 505 S Miramar Ave Unit 2202 is a home located in Brevard County with nearby schools including Indialantic Elementary School, Herbert C. Hoover Middle School, and Melbourne Senior High School.
Ownership History
Date
Name
Owned For
Owner Type
Purchase Details
Closed on
Dec 24, 2024
Sold by
Charles P Schwarz Amended P and Charles Restated L
Bought by
Charles P Schwarz Amended And Restated Living and Schwarz
Current Estimated Value
Purchase Details
Closed on
Jun 4, 2014
Sold by
Schwarz Charles P
Bought by
Schwarz Charles P and Charles P Schwarz Amended & Restated Liv
Purchase Details
Closed on
Apr 30, 2008
Sold by
Fouke George L and Eddy Dorothy L
Bought by
Schwarz Charles P
Purchase Details
Closed on
Aug 31, 2006
Sold by
Magnolia Key Development Inc
Bought by
Fouke George L and Eddy Dorothy L
Home Financials for this Owner
Home Financials are based on the most recent Mortgage that was taken out on this home.
Original Mortgage
$600,248
Interest Rate
1%
Mortgage Type
Purchase Money Mortgage
Create a Home Valuation Report for This Property
The Home Valuation Report is an in-depth analysis detailing your home's value as well as a comparison with similar homes in the area
Home Values in the Area
Average Home Value in this Area
Purchase History
| Date | Buyer | Sale Price | Title Company |
|---|---|---|---|
| Charles P Schwarz Amended And Restated Living | $100 | Landing Title Agency | |
| Schwarz Charles P | -- | Landing Title Agency Inc | |
| Schwarz Charles P | $600,000 | Alliance Title Insurance Age | |
| Fouke George L | $750,400 | Alliance Title Brevard Llc |
Source: Public Records
Mortgage History
| Date | Status | Borrower | Loan Amount |
|---|---|---|---|
| Previous Owner | Fouke George L | $600,248 |
Source: Public Records
Tax History
| Year | Tax Paid | Tax Assessment Tax Assessment Total Assessment is a certain percentage of the fair market value that is determined by local assessors to be the total taxable value of land and additions on the property. | Land | Improvement |
|---|---|---|---|---|
| 2025 | $15,526 | $871,750 | -- | -- |
| 2024 | $14,774 | $894,820 | -- | -- |
| 2023 | $14,774 | $894,820 | -- | -- |
| 2022 | $12,709 | $778,020 | $0 | $0 |
| 2021 | $12,092 | $667,310 | $0 | $667,310 |
| 2020 | $11,731 | $637,220 | $0 | $637,220 |
| 2019 | $10,859 | $582,160 | $0 | $582,160 |
| 2018 | $11,573 | $611,120 | $0 | $611,120 |
| 2017 | $10,317 | $545,500 | $0 | $545,500 |
| 2016 | $9,960 | $509,690 | $0 | $0 |
| 2015 | $9,782 | $480,840 | $0 | $0 |
| 2014 | $9,479 | $457,680 | $0 | $0 |
Source: Public Records
Map
Nearby Homes
- 1 Eighth Ave Unit 1201
- 1 Eighth Ave Unit 1204
- 1 Eighth Ave Unit 1403
- 101 Tradewinds Terrace
- 103 Tradewinds Terrace
- 700 Wave Crest Ave Unit 206
- 700 Wavecrest Ave Unit 301
- 240 9th Terrace
- 223 6th Ave
- 104 4th Ave
- 106 4th Ave
- 1004 Wave Crest Ave
- 1006 Wave Crest Ave
- 1010 Wave Crest Ave
- 1008 Wave Crest Ave
- 1012 Wave Crest Ave
- 101 Melbourne Ave Unit A
- 901 S Palm Ave
- 139 2nd Ave
- 1101 S Miramar Ave Unit 209
- 505 S Miramar Ave Unit 403
- 505 S Miramar Ave Unit 2405
- 505 S Miramar Ave Unit 2204
- 505 S Miramar Ave Unit 2404
- 505 S Miramar Ave Unit 2205
- 505 S Miramar Ave Unit 2203
- 505 S Miramar Ave Unit 2401
- 505 S Miramar Ave Unit 2304
- 505 S Miramar Ave Unit 2201
- 505 S Miramar Ave Unit 2402
- 505 S Miramar Ave Unit 2305
- 505 S Miramar Ave Unit 2303
- 505 S Miramar Ave Unit 2302
- 505 S Miramar Ave Unit 2301
- 505 S Miramar Ave
- 101 9th Ave Unit D
- 101 9th Ave
- 3425 Jimmy Buffett Memorial Hwy
- 2900291 Highway A1a
- 1 Eighth Ave Unit 1301
Your Personal Tour Guide
Ask me questions while you tour the home.