Estimated Value: $371,532 - $520,000
3
Beds
2
Baths
1,918
Sq Ft
$225/Sq Ft
Est. Value
About This Home
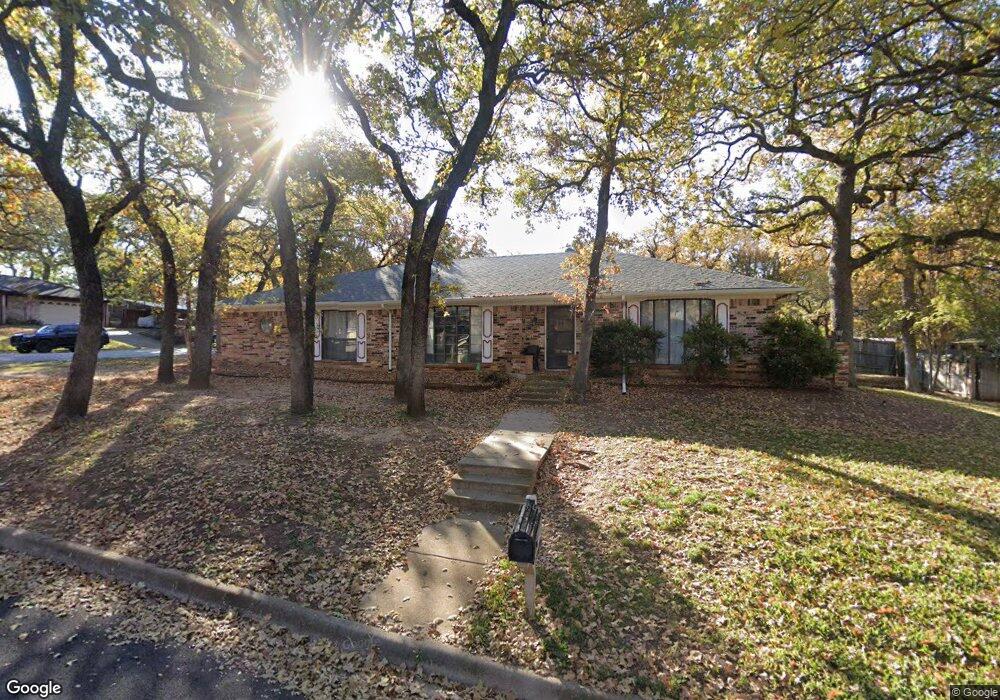
This home is located at 505 Stonehenge Dr, Hurst, TX 76054 and is currently estimated at $432,383, approximately $225 per square foot. 505 Stonehenge Dr is a home located in Tarrant County with nearby schools including Shady Oaks Elementary School, Bedford Junior High School, and L.D. Bell High School.
Ownership History
Date
Name
Owned For
Owner Type
Purchase Details
Closed on
Dec 29, 2015
Sold by
Brittain Barry W and Brittain Rebecca
Bought by
Fondrier Alexander N and Fondrier Elizabeth A
Current Estimated Value
Home Financials for this Owner
Home Financials are based on the most recent Mortgage that was taken out on this home.
Original Mortgage
$164,000
Outstanding Balance
$126,182
Interest Rate
3%
Mortgage Type
Adjustable Rate Mortgage/ARM
Estimated Equity
$306,201
Purchase Details
Closed on
Feb 23, 2007
Sold by
Ingles Linda Sue
Bought by
Brittain Barry W
Home Financials for this Owner
Home Financials are based on the most recent Mortgage that was taken out on this home.
Original Mortgage
$127,800
Interest Rate
6.21%
Mortgage Type
Purchase Money Mortgage
Purchase Details
Closed on
Dec 11, 1997
Sold by
Ingles Richard A
Bought by
Ingles Linda Sue
Create a Home Valuation Report for This Property
The Home Valuation Report is an in-depth analysis detailing your home's value as well as a comparison with similar homes in the area
Home Values in the Area
Average Home Value in this Area
Purchase History
| Date | Buyer | Sale Price | Title Company |
|---|---|---|---|
| Fondrier Alexander N | -- | Capital Title | |
| Brittain Barry W | -- | American Title | |
| Ingles Linda Sue | -- | -- |
Source: Public Records
Mortgage History
| Date | Status | Borrower | Loan Amount |
|---|---|---|---|
| Open | Fondrier Alexander N | $164,000 | |
| Previous Owner | Brittain Barry W | $127,800 |
Source: Public Records
Tax History
| Year | Tax Paid | Tax Assessment Tax Assessment Total Assessment is a certain percentage of the fair market value that is determined by local assessors to be the total taxable value of land and additions on the property. | Land | Improvement |
|---|---|---|---|---|
| 2025 | $5,532 | $350,000 | $75,000 | $275,000 |
| 2024 | $5,532 | $350,000 | $75,000 | $275,000 |
| 2023 | $6,234 | $325,000 | $55,000 | $270,000 |
| 2022 | $6,814 | $312,000 | $55,000 | $257,000 |
| 2021 | $7,040 | $298,850 | $55,000 | $243,850 |
| 2020 | $6,470 | $272,106 | $55,000 | $217,106 |
| 2019 | $6,457 | $283,950 | $55,000 | $228,950 |
| 2018 | $5,488 | $241,637 | $55,000 | $186,637 |
| 2017 | $5,314 | $219,670 | $18,000 | $201,670 |
| 2016 | $4,994 | $206,417 | $18,000 | $188,417 |
| 2015 | $4,214 | $181,300 | $18,000 | $163,300 |
| 2014 | $4,214 | $181,300 | $18,000 | $163,300 |
Source: Public Records
Map
Nearby Homes
- 2244 Hurstview Dr
- 2204 Mountainview Dr
- 2201 Mountainview Dr
- 2221 Farrington Ln
- 317 Northglen Dr
- 2157 Lookout Ct
- 617 Indian Trail
- 2620 Brookridge Dr
- 421 Cavender Ct
- 200 Eagle Ct
- 404 Mountainview Dr
- 305 Warbler Dr
- 3716 Sweetbriar Ln
- 104 Greenbriar Ln
- 712 Springhill Dr
- 405 Woodbriar Ct
- 1905 Cimarron Trail
- 413 Blue Jay Ct
- 736 Springhill Dr
- 3006 Carolyn Ct
- 2249 Cambridge Dr
- 509 Stonehenge Dr
- 413 Stonehenge Dr
- 504 Stonehenge Dr
- 416 Stonehenge Dr
- 2245 Cambridge Dr
- 508 Stonehenge Dr
- 2244 Mountainview Dr
- 513 Stonehenge Dr
- 412 Stonehenge Dr
- 412 Heather Ln
- 409 Stonehenge Dr
- 2241 Cambridge Dr
- 512 Stonehenge Dr
- 408 Stonehenge Dr
- 2240 Mountainview Dr
- 2248 Mountainview Dr
- 505 Cumberland Dr
- 408 Heather Ln
- 417 Cumberland Dr
Your Personal Tour Guide
Ask me questions while you tour the home.