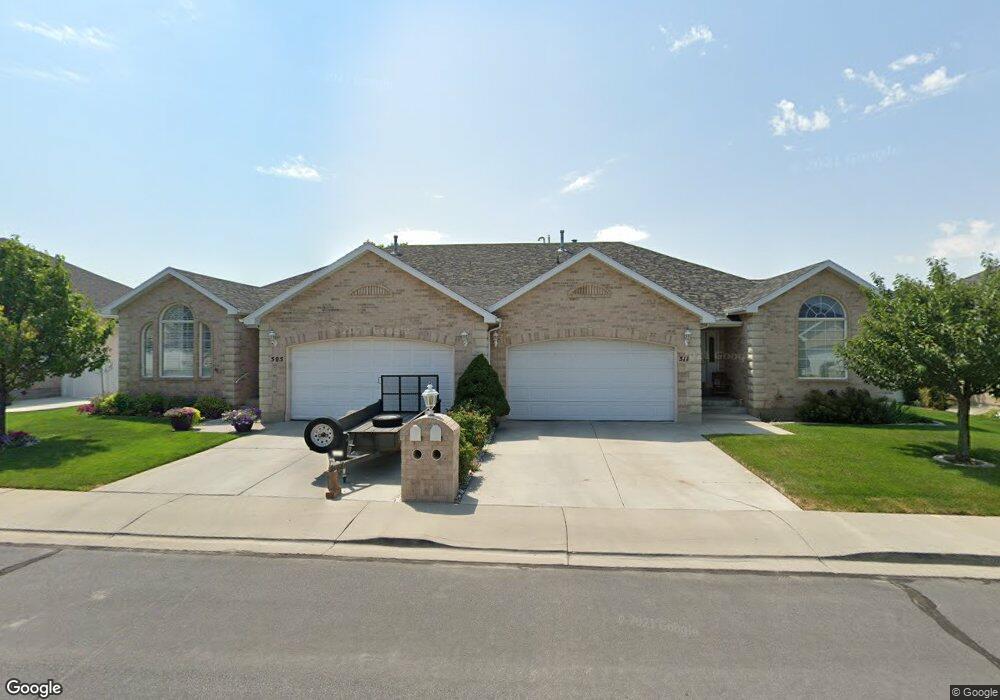
505 W 40 N Orem, UT 84057
Suncrest NeighborhoodEstimated Value: $543,000 - $599,000
5
Beds
3
Baths
3,182
Sq Ft
$178/Sq Ft
Est. Value
About This Home
This home is located at 505 W 40 N, Orem, UT 84057 and is currently estimated at $565,494, approximately $177 per square foot. 505 W 40 N is a home located in Utah County with nearby schools including Orem Junior High School, Mountain View High School, and Noah Webster Academy.
Ownership History
Date
Name
Owned For
Owner Type
Purchase Details
Closed on
Sep 1, 2017
Sold by
Wickham Kent E and Wickham Linda
Bought by
Paulson Max and Paulson Jeanne
Current Estimated Value
Purchase Details
Closed on
Sep 20, 2016
Sold by
Wickham Kent E and Wickham Linda
Bought by
Wickham Linda and Wickham Kent E
Purchase Details
Closed on
Jan 29, 1997
Sold by
Adm Development L C
Bought by
Wickham Kent E and Wickham Linda
Home Financials for this Owner
Home Financials are based on the most recent Mortgage that was taken out on this home.
Original Mortgage
$150,000
Interest Rate
7.74%
Create a Home Valuation Report for This Property
The Home Valuation Report is an in-depth analysis detailing your home's value as well as a comparison with similar homes in the area
Home Values in the Area
Average Home Value in this Area
Purchase History
| Date | Buyer | Sale Price | Title Company |
|---|---|---|---|
| Paulson Max | -- | First American Title | |
| Wickham Linda | -- | None Available | |
| Wickham Kent E | -- | -- |
Source: Public Records
Mortgage History
| Date | Status | Borrower | Loan Amount |
|---|---|---|---|
| Previous Owner | Wickham Kent E | $150,000 |
Source: Public Records
Tax History
| Year | Tax Paid | Tax Assessment Tax Assessment Total Assessment is a certain percentage of the fair market value that is determined by local assessors to be the total taxable value of land and additions on the property. | Land | Improvement |
|---|---|---|---|---|
| 2025 | $684 | $284,460 | -- | -- |
| 2024 | $684 | $285,835 | $0 | $0 |
| 2023 | $834 | $301,345 | $0 | $0 |
| 2022 | $1,217 | $268,565 | $0 | $0 |
| 2021 | $878 | $369,900 | $75,600 | $294,300 |
| 2020 | $764 | $342,500 | $75,600 | $266,900 |
| 2019 | $1,577 | $310,800 | $75,600 | $235,200 |
| 2018 | $1,650 | $310,800 | $75,600 | $235,200 |
| 2017 | $1,645 | $165,990 | $0 | $0 |
| 2016 | $1,495 | $139,095 | $0 | $0 |
| 2015 | $1,513 | $133,100 | $0 | $0 |
| 2014 | $1,357 | $118,800 | $0 | $0 |
Source: Public Records
Map
Nearby Homes
Your Personal Tour Guide
Ask me questions while you tour the home.