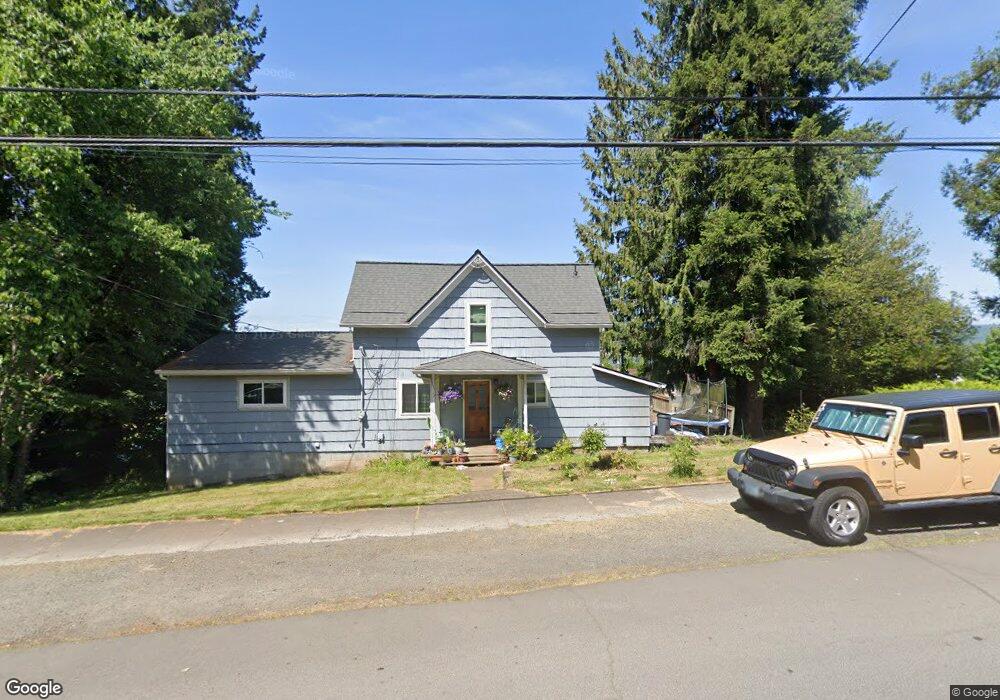
505 W C St Rainier, OR 97048
Estimated Value: $355,562 - $467,000
4
Beds
2
Baths
2,156
Sq Ft
$190/Sq Ft
Est. Value
About This Home
This home is located at 505 W C St, Rainier, OR 97048 and is currently estimated at $410,641, approximately $190 per square foot. 505 W C St is a home with nearby schools including Hudson Park Elementary School, Rainier Junior/Senior High School, and North Columbia Academy.
Ownership History
Date
Name
Owned For
Owner Type
Purchase Details
Closed on
Mar 22, 2007
Sold by
Head Meryl L
Bought by
Wanamaker Mathew D and Wanamaker Sherry L
Current Estimated Value
Home Financials for this Owner
Home Financials are based on the most recent Mortgage that was taken out on this home.
Original Mortgage
$181,000
Outstanding Balance
$109,856
Interest Rate
6.31%
Mortgage Type
VA
Estimated Equity
$300,785
Create a Home Valuation Report for This Property
The Home Valuation Report is an in-depth analysis detailing your home's value as well as a comparison with similar homes in the area
Home Values in the Area
Average Home Value in this Area
Purchase History
| Date | Buyer | Sale Price | Title Company |
|---|---|---|---|
| Wanamaker Mathew D | $181,000 | Ticor Title |
Source: Public Records
Mortgage History
| Date | Status | Borrower | Loan Amount |
|---|---|---|---|
| Open | Wanamaker Mathew D | $181,000 |
Source: Public Records
Tax History Compared to Growth
Tax History
| Year | Tax Paid | Tax Assessment Tax Assessment Total Assessment is a certain percentage of the fair market value that is determined by local assessors to be the total taxable value of land and additions on the property. | Land | Improvement |
|---|---|---|---|---|
| 2025 | $2,627 | $142,240 | $39,950 | $102,290 |
| 2024 | $2,566 | $138,100 | $38,790 | $99,310 |
| 2023 | $2,530 | $134,080 | $32,070 | $102,010 |
| 2022 | $2,416 | $130,180 | $31,140 | $99,040 |
| 2021 | $2,377 | $126,390 | $34,020 | $92,370 |
| 2020 | $2,310 | $122,710 | $30,610 | $92,100 |
| 2019 | $2,273 | $119,140 | $37,380 | $81,760 |
| 2018 | $2,221 | $115,670 | $51,730 | $63,940 |
| 2017 | $2,200 | $112,310 | $50,220 | $62,090 |
| 2016 | $2,137 | $109,040 | $48,760 | $60,280 |
| 2015 | $1,707 | $97,300 | $41,160 | $56,140 |
| 2014 | $1,615 | $92,170 | $41,060 | $51,110 |
Source: Public Records
Map
Nearby Homes