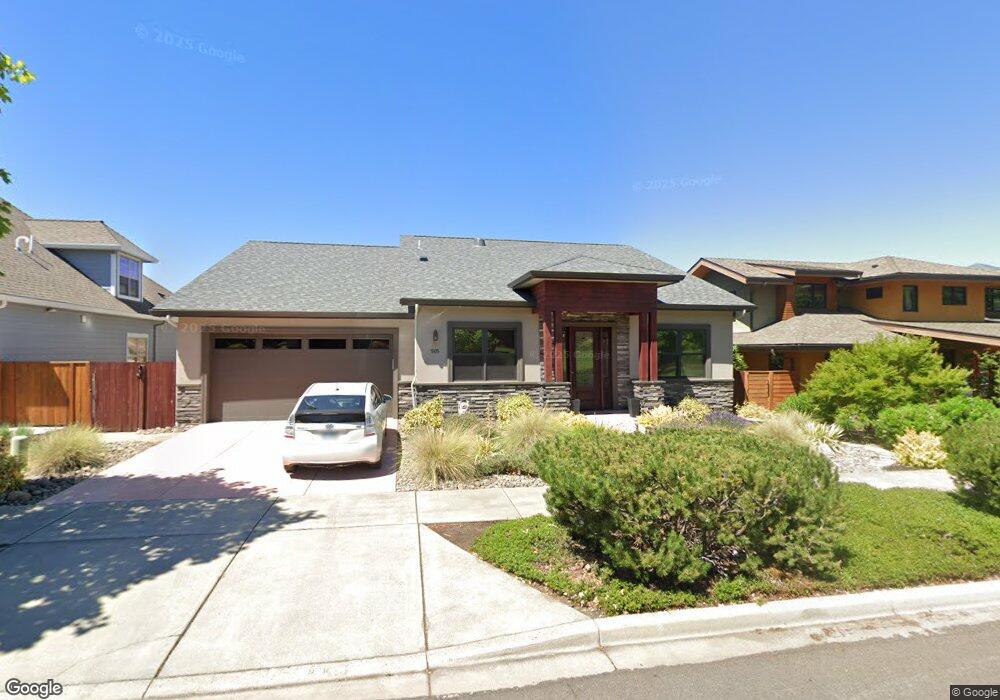
505 W Nevada St Ashland, OR 97520
Quiet Village NeighborhoodEstimated Value: $777,000 - $955,000
3
Beds
2
Baths
2,289
Sq Ft
$378/Sq Ft
Est. Value
About This Home
This home is located at 505 W Nevada St, Ashland, OR 97520 and is currently estimated at $864,595, approximately $377 per square foot. 505 W Nevada St is a home located in Jackson County with nearby schools including Helman Elementary School, Ashland Middle School, and Ashland High School.
Ownership History
Date
Name
Owned For
Owner Type
Purchase Details
Closed on
Aug 19, 2021
Sold by
May Jennifer Lori and Lotus Trust
Bought by
Wallen Marcia S and Marcia S Wallen Trust
Current Estimated Value
Purchase Details
Closed on
Dec 15, 2020
Sold by
Albrecht Leah and Brady Maree Therese
Bought by
Steinbergs John R and Steinbergs Carmen V
Home Financials for this Owner
Home Financials are based on the most recent Mortgage that was taken out on this home.
Original Mortgage
$694,800
Interest Rate
2.7%
Mortgage Type
New Conventional
Purchase Details
Closed on
Apr 16, 2019
Sold by
Mh Smith Inc
Bought by
Albrecht Leah and Brady Maree Therese
Home Financials for this Owner
Home Financials are based on the most recent Mortgage that was taken out on this home.
Original Mortgage
$626,400
Interest Rate
4.3%
Mortgage Type
Small Business Administration
Purchase Details
Closed on
Jun 19, 2017
Sold by
Melanie H Smith Llc
Bought by
Mh Smith Inc
Purchase Details
Closed on
Feb 20, 2008
Sold by
Bank Of The Cascades
Bought by
Bamforth Bert and Bamforth Judith Alene
Create a Home Valuation Report for This Property
The Home Valuation Report is an in-depth analysis detailing your home's value as well as a comparison with similar homes in the area
Home Values in the Area
Average Home Value in this Area
Purchase History
| Date | Buyer | Sale Price | Title Company |
|---|---|---|---|
| Wallen Marcia S | $940,000 | First American Title | |
| Steinbergs John R | $868,500 | First American Title | |
| Albrecht Leah | $185,000 | First American Title | |
| Mh Smith Inc | -- | Accommodation | |
| Bamforth Bert | $125,000 | Amerititle |
Source: Public Records
Mortgage History
| Date | Status | Borrower | Loan Amount |
|---|---|---|---|
| Previous Owner | Steinbergs John R | $694,800 | |
| Previous Owner | Albrecht Leah | $626,400 |
Source: Public Records
Tax History Compared to Growth
Tax History
| Year | Tax Paid | Tax Assessment Tax Assessment Total Assessment is a certain percentage of the fair market value that is determined by local assessors to be the total taxable value of land and additions on the property. | Land | Improvement |
|---|---|---|---|---|
| 2025 | $6,962 | $449,020 | $159,810 | $289,210 |
| 2024 | $6,962 | $435,950 | $155,160 | $280,790 |
| 2023 | $6,735 | $423,260 | $150,640 | $272,620 |
| 2022 | $6,519 | $423,260 | $150,640 | $272,620 |
| 2021 | $6,297 | $410,940 | $146,250 | $264,690 |
| 2020 | $6,120 | $398,980 | $141,990 | $256,990 |
| 2019 | $1,641 | $102,430 | $102,430 | $354,880 |
| 2018 | $1,550 | $99,450 | $99,450 | $0 |
| 2017 | $1,539 | $99,450 | $99,450 | $0 |
| 2016 | $1,499 | $93,750 | $93,750 | $0 |
| 2015 | $1,441 | $93,750 | $93,750 | $0 |
| 2014 | $1,394 | $88,370 | $88,370 | $0 |
Source: Public Records
Map
Nearby Homes
- 472 Lindsay Ln
- 662 Vansant St
- 242 Grant St
- 230 Grant St
- 566 Coffee Ln
- 364 Randy St
- 356 Randy St
- 720 Grover St
- 332 Randy St
- 595 Elizabeth Ave
- 581 Scenic Dr Unit 9
- 360 Coventry Place
- 317 Maple St
- 323 Glenn St Unit 6
- 311 Glenn St Unit 3
- 330 Glenn St
- 0 Schofield St Unit TL7200-TL7100
- 67 Woolen Way
- 111 Nursery St
- 451 N Main St
- 505 W Nevada St Unit 11
- 495 W Nevada Unit 10
- 495 W Nevada
- 515 W Nevada St Unit 12
- 515 W Nevada St
- 525 W Nevada St Unit 13
- 525 W Nevada St
- 485 W Nevada St Unit 9
- 485 W Nevada St
- 500 W Nevada St
- 510 W Nevada St Unit 26
- 510 W Nevada St
- 535 W Nevada St Unit 14
- 535 W Nevada St
- 475 W Nevada St Unit 8
- 475 W Nevada St
- 465 W Nevada St Unit 7
- 465 W Nevada St
- 534 W Nevada St Unit 23
- 534 W Nevada St