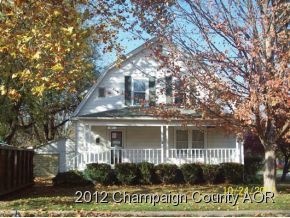
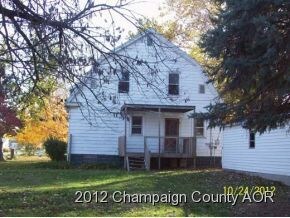
505 W Spruce St Unit 1 Chatham, IL 62629
Estimated Value: $192,000 - $227,000
Highlights
- 1 Car Detached Garage
- Living Room
- Dining Room
- Glenwood High School Rated A-
- Forced Air Heating System
About This Home
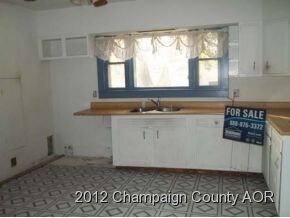
As of February 2013REO PROPERTY - BANK OWNED. PROPERTY SOLD AS IS WITHOUT REPAIR, WARRANTY OR SELLER DISCLOSURE. The Listing Broker and Seller assume no responsibility and make no guarantees, warranties or representations as to the availability or accuracy of the property information, photographs, or other information depicted or described herein.Seller will not activate utilities. Web technology fee of $299 paid at closing by the buyer. CASH AND CONVENTIONAL ONLY
Home Details
Home Type
- Single Family
Est. Annual Taxes
- $2,630
Lot Details
- 0.25
Parking
- 1 Car Detached Garage
Home Design
- Vinyl Siding
Interior Spaces
- 2,000 Sq Ft Home
- 2-Story Property
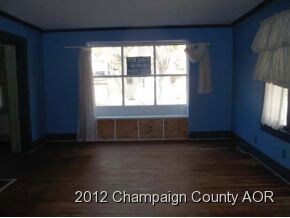
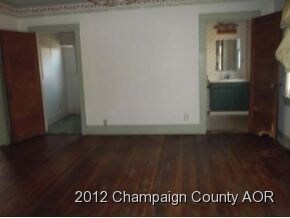
- Living Room
- Dining Room
- Partially Finished Basement
- Basement Fills Entire Space Under The House
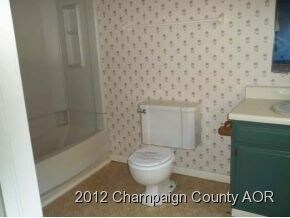
Bedrooms and Bathrooms
- 3 Bedrooms
- 3 Potential Bedrooms
Utilities
- Forced Air Heating System
- Heating System Uses Natural Gas
Ownership History
Purchase Details
Home Financials for this Owner
Home Financials are based on the most recent Mortgage that was taken out on this home.Purchase Details
Purchase Details
Purchase Details
Purchase Details
Purchase Details
Purchase Details
Purchase Details
Purchase Details
Purchase Details
Home Values in the Area
Average Home Value in this Area
Purchase History
| Date | Buyer | Sale Price | Title Company |
|---|---|---|---|
| -- | $73,000 | -- | |
| -- | -- | -- | |
| -- | -- | -- | |
| -- | -- | -- | |
| -- | $105,000 | -- | |
| -- | -- | -- | |
| -- | $97,300 | -- | |
| -- | -- | -- | |
| -- | $94,000 | -- | |
| -- | -- | -- |
Property History
| Date | Event | Price | Change | Sq Ft Price |
|---|---|---|---|---|
| 02/26/2013 02/26/13 | Sold | $72,999 | 0.0% | $36 / Sq Ft |
| 01/30/2013 01/30/13 | Pending | -- | -- | -- |
| 11/01/2012 11/01/12 | For Sale | $72,999 | -- | $36 / Sq Ft |
Tax History Compared to Growth
Tax History
| Year | Tax Paid | Tax Assessment Tax Assessment Total Assessment is a certain percentage of the fair market value that is determined by local assessors to be the total taxable value of land and additions on the property. | Land | Improvement |
|---|---|---|---|---|
| 2024 | $3,834 | $53,466 | $779 | $52,687 |
| 2023 | $3,695 | $49,205 | $717 | $48,488 |
| 2022 | $3,637 | $47,390 | $691 | $46,699 |
| 2021 | $3,605 | $46,597 | $679 | $45,918 |
| 2020 | $3,518 | $45,460 | $662 | $44,798 |
| 2019 | $3,461 | $45,405 | $661 | $44,744 |
| 2018 | $3,373 | $44,871 | $653 | $44,218 |
| 2017 | $3,337 | $44,383 | $646 | $43,737 |
| 2016 | $3,283 | $43,466 | $633 | $42,833 |
| 2015 | $3,304 | $43,044 | $627 | $42,417 |
| 2014 | $3,290 | $42,555 | $620 | $41,935 |
| 2013 | $3,230 | $41,901 | $610 | $41,291 |
Map
Source: Midwest Real Estate Data (MRED)
MLS Number: 09465748
APN: 28-12.0-453-007
Disclaimer: Certain information contained herein is derived from information provided by parties other than Homes.com. All information provided is deemed reliable, but is not guaranteed to be accurate and should be independently verified.
![]() Based on information submitted to the MLS GRID. All data is obtained from various sources and may not have been verified by broker or MLS GRID. Supplied Open House Information is subject to change without notice. All information should be independently reviewed and verified for accuracy. Properties may or may not be listed by the office/agent presenting the information. Some IDX listings have been excluded from this website.
Based on information submitted to the MLS GRID. All data is obtained from various sources and may not have been verified by broker or MLS GRID. Supplied Open House Information is subject to change without notice. All information should be independently reviewed and verified for accuracy. Properties may or may not be listed by the office/agent presenting the information. Some IDX listings have been excluded from this website.
The Digital Millennium Copyright Act of 1998, 17 U.S.C. § 512 (the “DMCA”) provides recourse for copyright owners who believe that material appearing on the Internet infringes their rights under U.S. copyright law. If you believe in good faith that any content or material made available in connection with our website or services infringes your copyright, you (or your agent) may send us a notice requesting that the content or material be removed, or access to it blocked.
Notices must be sent in writing by email to DMCAnotice@MLSGrid.com.
The DMCA requires that your notice of alleged copyright infringement include the following information:
(1) description of the copyrighted work that is the subject of claimed infringement;
(2) description of the alleged infringing content and information sufficient to permit us to locate the content;
(3) contact information for you, including your address, telephone number and email address;
(4) a statement by you that you have a good faith belief that the content in the manner complained of is not authorized by the copyright owner, or its agent, or by the operation of any law;
(5) a statement by you, signed under penalty of perjury, that the information in the notification is accurate and that you have the authority to enforce the copyrights that are claimed to be infringed; and
(6) a physical or electronic signature of the copyright owner or a person authorized to act on the copyright owner’s behalf. Failure to include all of the above information may result in the delay of the processing of your complaint.
- 600 W Spruce St Unit 1
- 26 Circle
- 0 State Route 4
- 211 E Locust St Unit 1
- 34 Buckingham Rd Unit 1
- 80 Bonniebrook Rd Unit 1
- 39 Bonniebrook Rd Unit 1
- 68 Moonlight Ct
- 415 E Spruce St Unit 1
- 419 E Chestnut St
- 510 E Chestnut St Unit 1
- 349 Woodland Dr Unit 1
- 520 Gatlinburg Dr
- 619 Woodland Dr Unit 1
- 26 Hawks Nest
- 300 Hodges Ct
- 1005 Campanella Dr
- 805 N Park Ave Unit 1
- 405 Hodges Ct
- 1017 Campanella Dr
- 509 W Spruce St
- 513 W Spruce St Unit 1
- 413 W Spruce St Unit 1
- 500 W Spruce St Unit 1
- 500 W Locust St Unit 1
- 412 W Spruce St
- 412 W Spruce St Unit 1
- 409 W Spruce St Unit 1
- 412 W Locust St Unit 1
- 508 W Locust St Unit 1
- 517 W Spruce St Unit 1
- 512 W Spruce St Unit 1
- 408 W Spruce St
- 516 W Spruce St
- 408 W Locust St
- 501 W Locust St Unit 1
- 315 S Taylor St Unit 1
- 405 W Spruce St Unit 1
- 601 W Spruce St Unit 1
- 411 S Grand Ave Unit 1