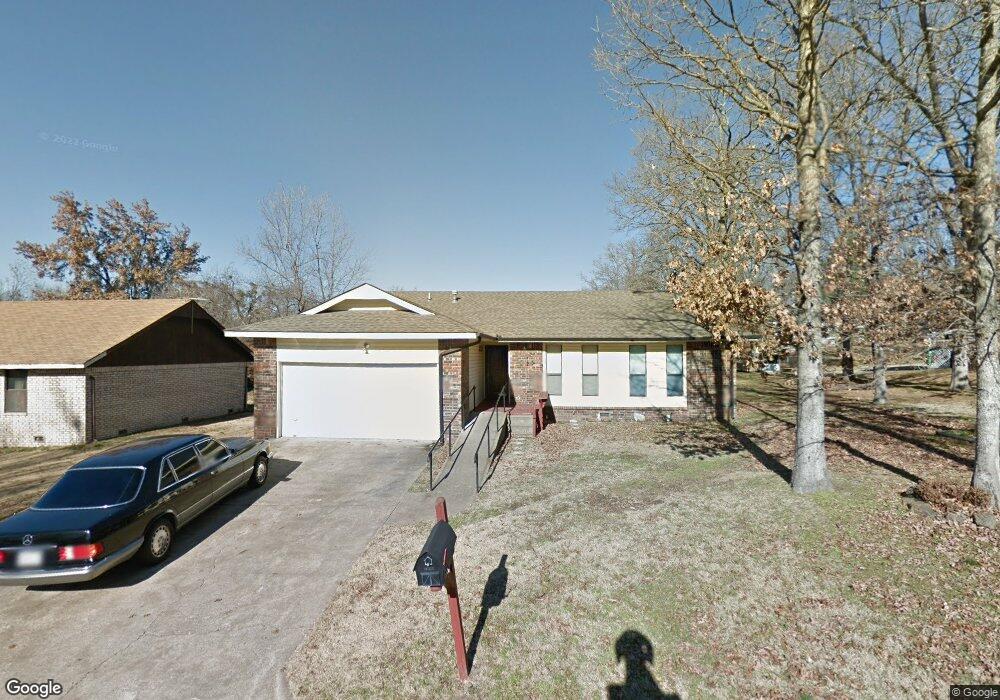
505 Wheeler St Tahlequah, OK 74464
Estimated Value: $177,077 - $196,000
3
Beds
2
Baths
1,324
Sq Ft
$142/Sq Ft
Est. Value
About This Home
This home is located at 505 Wheeler St, Tahlequah, OK 74464 and is currently estimated at $188,019, approximately $142 per square foot. 505 Wheeler St is a home located in Cherokee County with nearby schools including Cherokee Elementary School, Greenwood Elementary School, and Tahlequah Middle School.
Ownership History
Date
Name
Owned For
Owner Type
Purchase Details
Closed on
Dec 10, 2020
Sold by
Fouse Roger R and Fouse W R
Bought by
Chuckluck Mary Ann
Current Estimated Value
Purchase Details
Closed on
Sep 21, 2018
Sold by
Chuckluck Mary Ann
Bought by
Fouse Roger F and Fouse W R
Purchase Details
Closed on
Sep 8, 2015
Sold by
Chuckluck Mary Ann and Chuckluck Bridge
Bought by
Chuckluck Mary Ann
Purchase Details
Closed on
Feb 10, 2012
Sold by
Nofire Mary Ann and Chuckluck Bridge
Bought by
Chuckluck Mary Ann and Chuckluck Bridge
Purchase Details
Closed on
Mar 3, 2011
Sold by
Nofire Mary Ann and Nofire Clark R
Bought by
Nofire Mary Ann
Purchase Details
Closed on
Jul 3, 2006
Sold by
Nofrie Mary Ann
Bought by
Nofrie Mary Ann and W Clark Fouse R
Purchase Details
Closed on
Oct 6, 2005
Sold by
Nofire Eli and Nofire Mary Ann
Bought by
Nofire Mary Ann
Purchase Details
Closed on
Mar 25, 1994
Sold by
Boatmen'S 1St Ntl Bk
Bought by
Eli and Mary Ann Nofire
Create a Home Valuation Report for This Property
The Home Valuation Report is an in-depth analysis detailing your home's value as well as a comparison with similar homes in the area
Home Values in the Area
Average Home Value in this Area
Purchase History
| Date | Buyer | Sale Price | Title Company |
|---|---|---|---|
| Chuckluck Mary Ann | -- | None Available | |
| Fouse Roger F | -- | None Available | |
| Chuckluck Mary Ann | -- | None Available | |
| Chuckluck Mary Ann | -- | None Available | |
| Nofire Mary Ann | -- | None Available | |
| Nofrie Mary Ann | -- | None Available | |
| Nofire Mary Ann | -- | None Available | |
| Eli | $57,500 | -- |
Source: Public Records
Tax History Compared to Growth
Tax History
| Year | Tax Paid | Tax Assessment Tax Assessment Total Assessment is a certain percentage of the fair market value that is determined by local assessors to be the total taxable value of land and additions on the property. | Land | Improvement |
|---|---|---|---|---|
| 2025 | $785 | $9,921 | $1,485 | $8,436 |
| 2024 | $785 | $9,449 | $1,485 | $7,964 |
| 2023 | $785 | $8,999 | $1,485 | $7,514 |
| 2022 | $608 | $8,570 | $1,485 | $7,085 |
| 2021 | $579 | $8,162 | $1,485 | $6,677 |
| 2020 | $552 | $7,774 | $1,485 | $6,289 |
| 2019 | $574 | $7,403 | $1,485 | $5,918 |
| 2018 | $550 | $7,051 | $1,485 | $5,566 |
| 2017 | $397 | $7,051 | $1,485 | $5,566 |
| 2016 | $399 | $7,051 | $1,485 | $5,566 |
| 2015 | $396 | $7,051 | $1,485 | $5,566 |
| 2014 | $398 | $7,051 | $1,485 | $5,566 |
Source: Public Records
Map
Nearby Homes